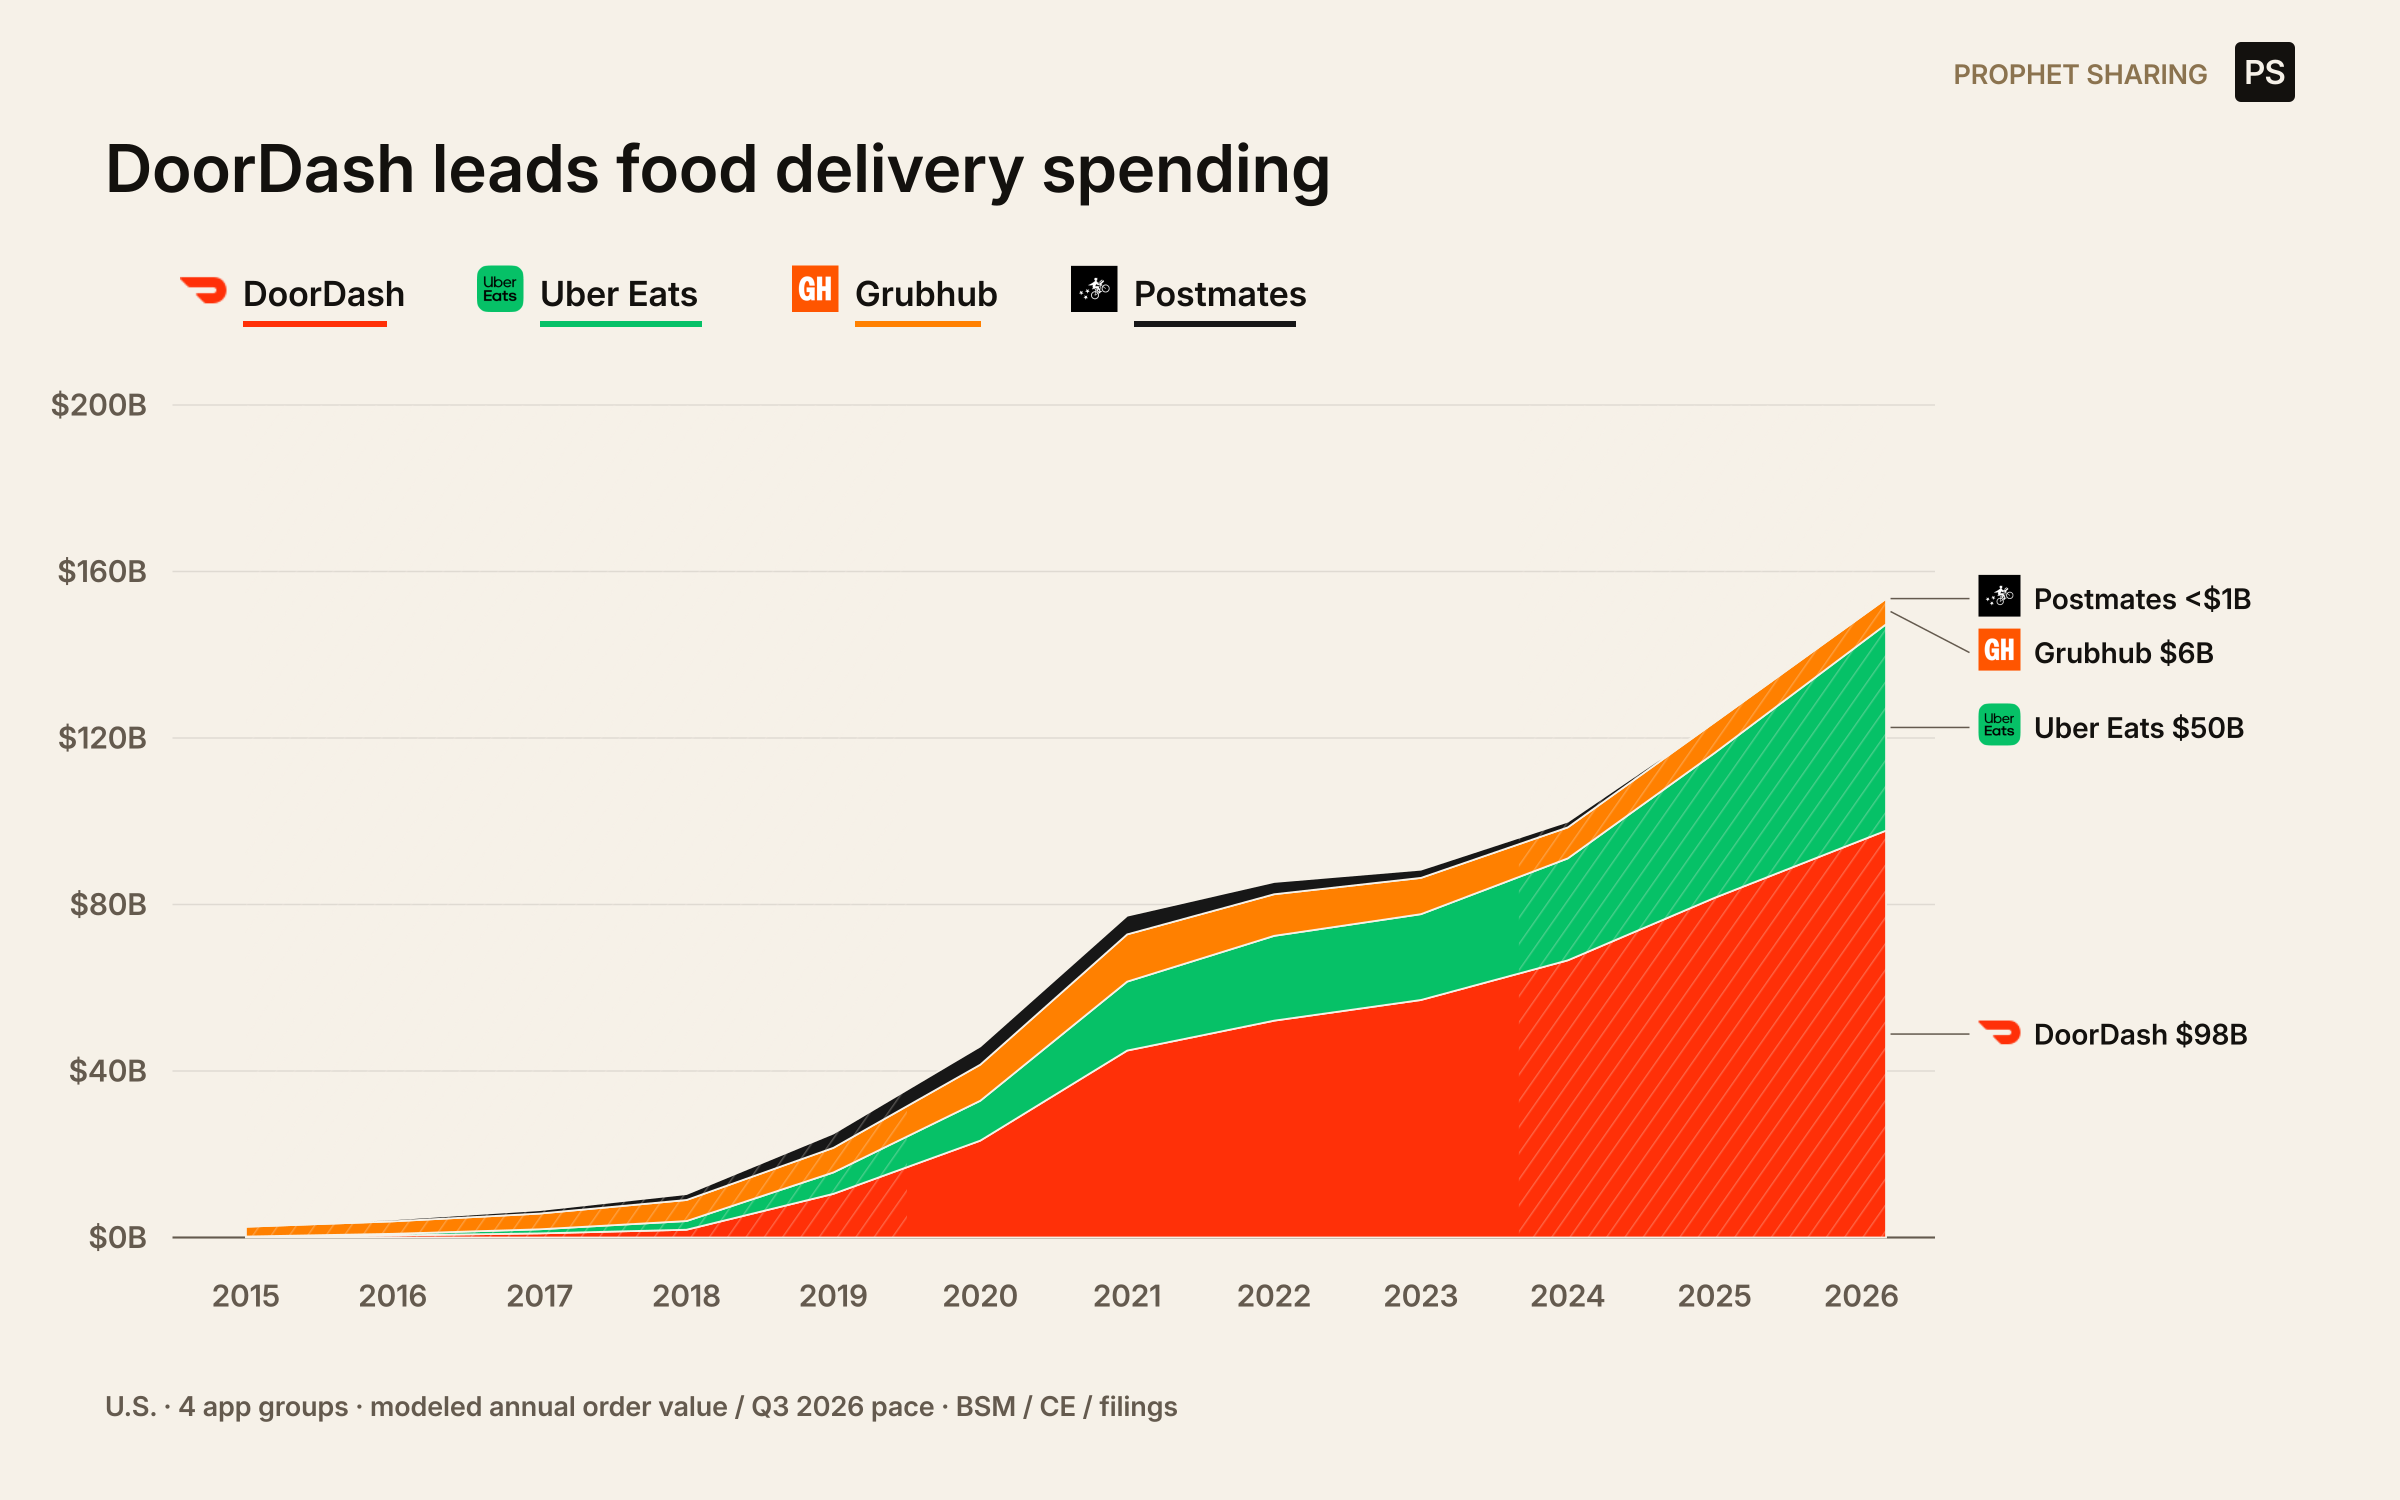
DoorDash leads food delivery spending
Sources & data
Bloomberg Second Measure; Consumer Edge / Earnest; Grubhub and DoorDash disclosures. Four app groups, including tracked nonrestaurant orders; early reconstruction and modern panel joins are modeled. Latest 2026 share mix is January held forward. Dollar charts use calendar-year models through 2025 and Q3 2026 annualized pace; source-period share history is separate.
Chart text
PS PROPHET SHARING DoorDash leads food delivery spending DoorDash Uber Eats Grubhub Postmates $0B $40B $80B $120B $160B $200B 2015 2016 2017 2018 2019 2020 2021 2022 2023 2024 2025 2026 Postmates <$1B Grubhub $6B Uber Eats $50B DoorDash $98B U.S. · 4 app groups · modeled annual order value / Q3 2026 pace · BSM / CE / filings