Food / Grocery
Data, sources and audit
Current data and definitions · Source audit and sensitivities · Export checks
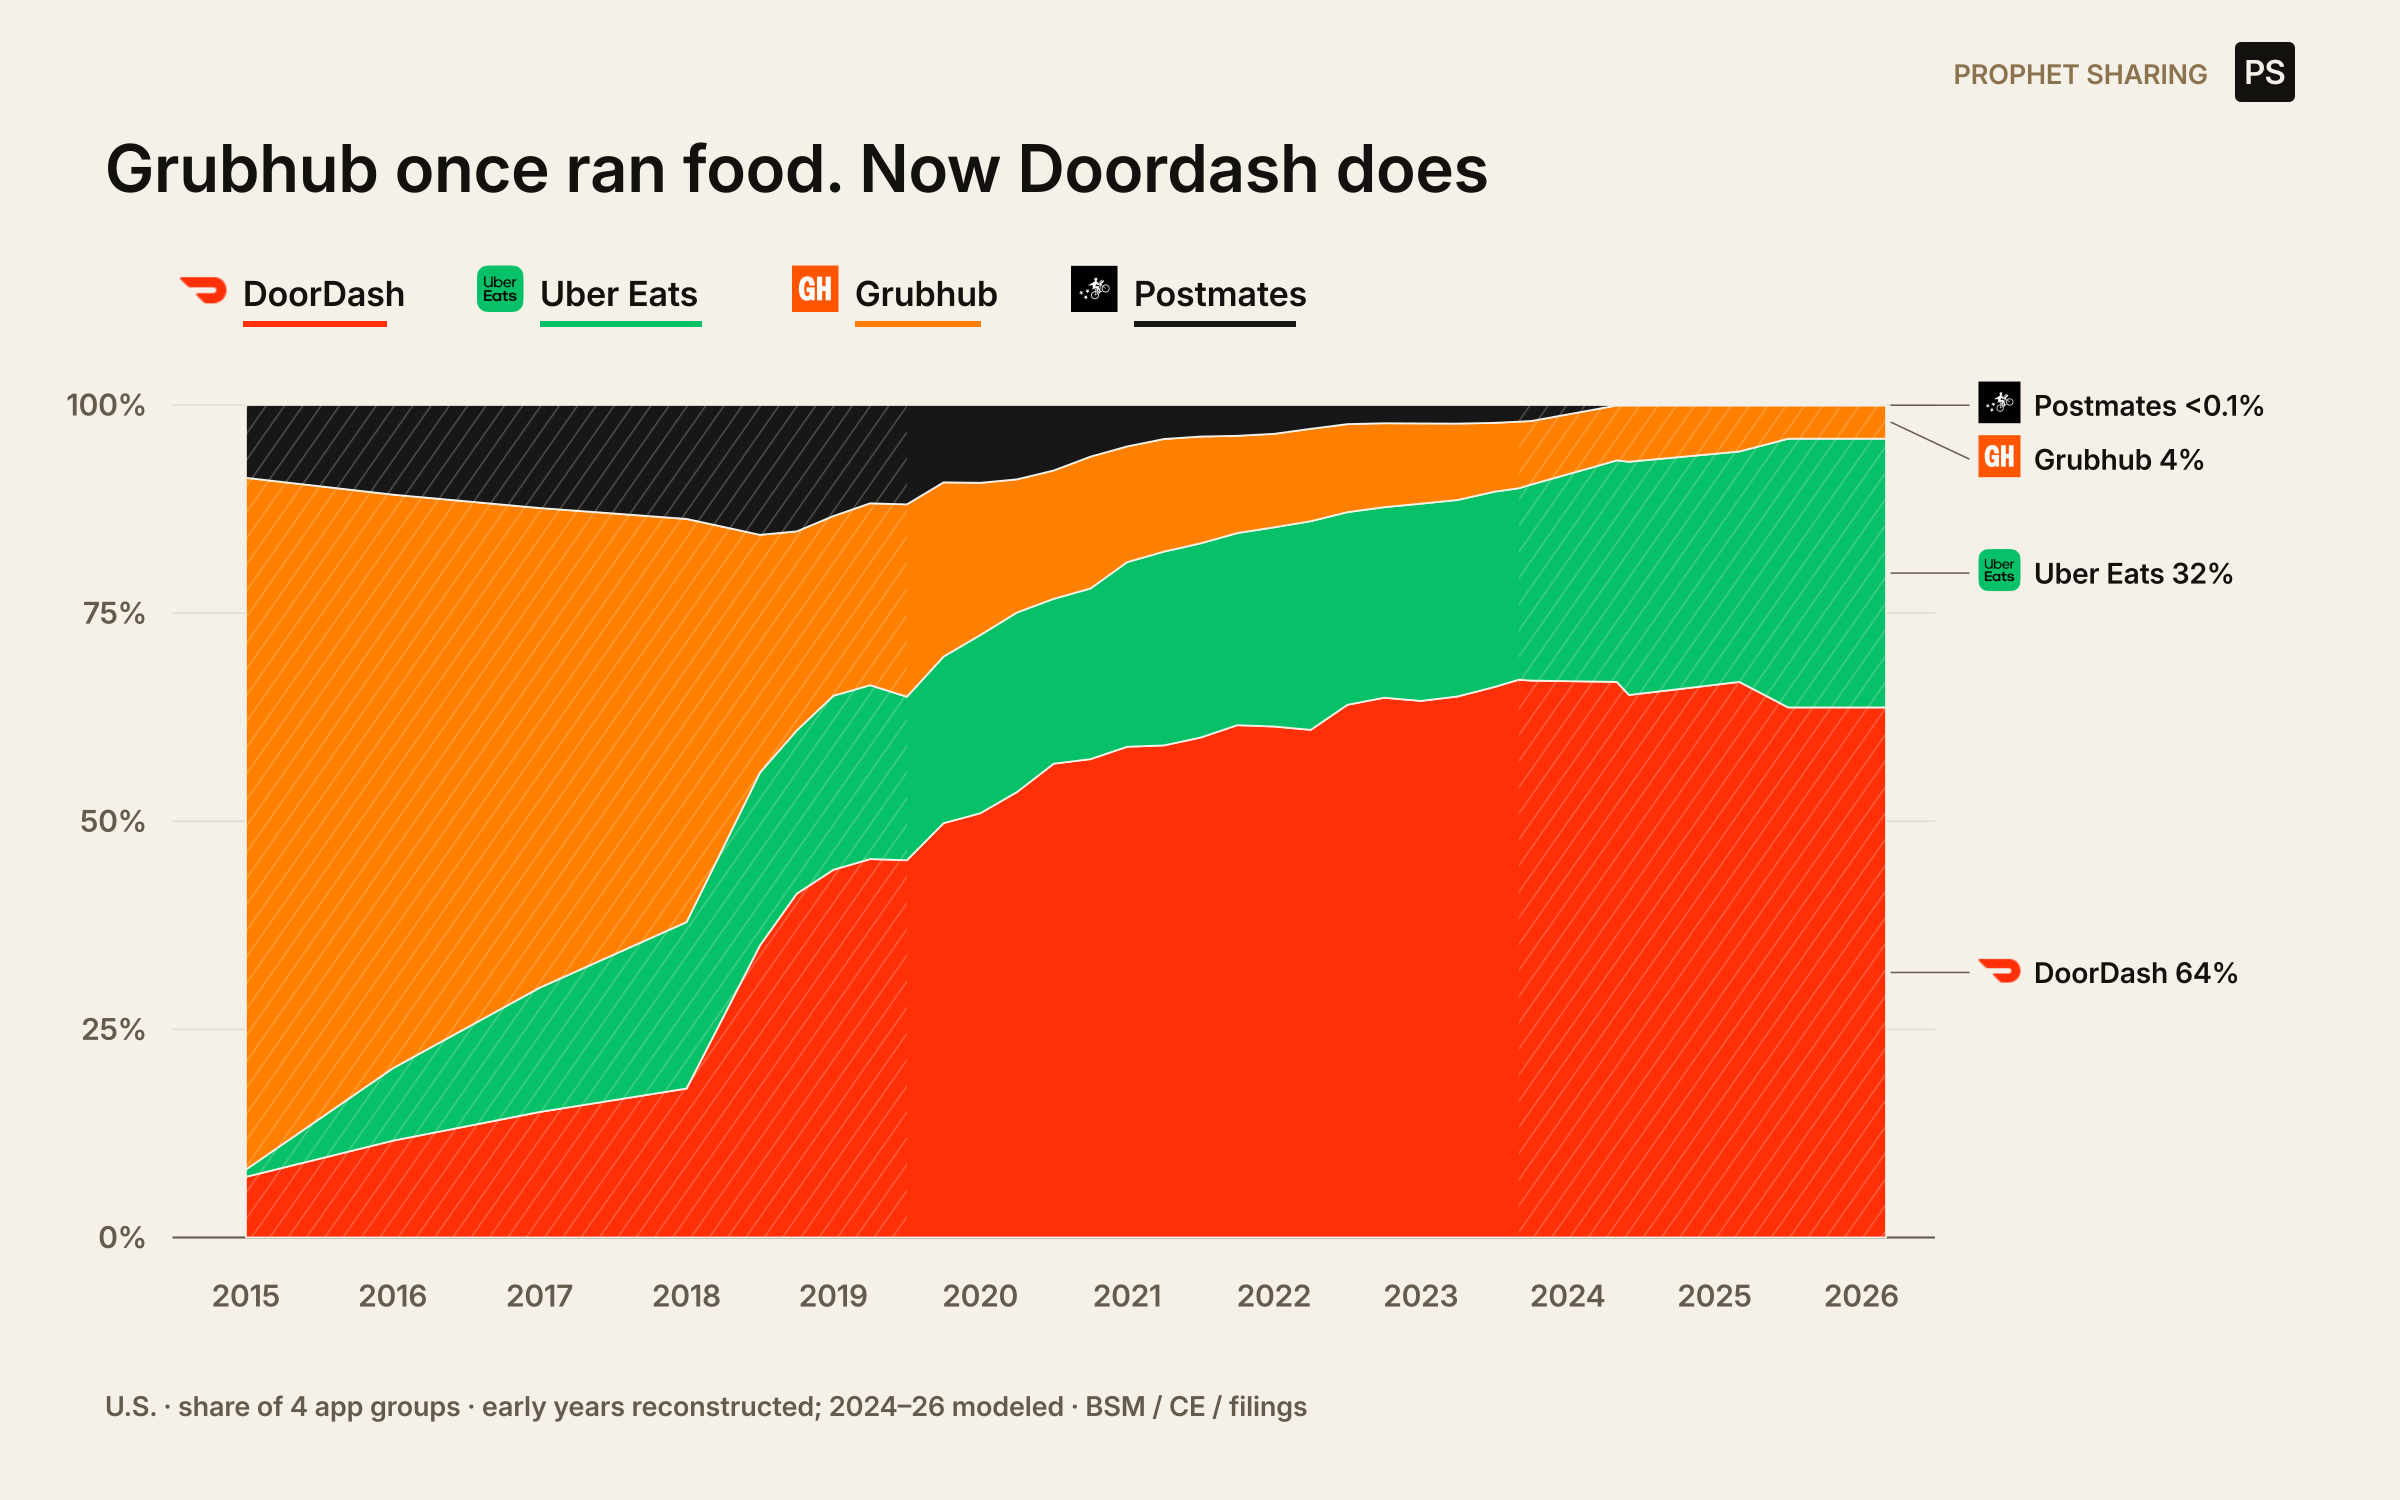
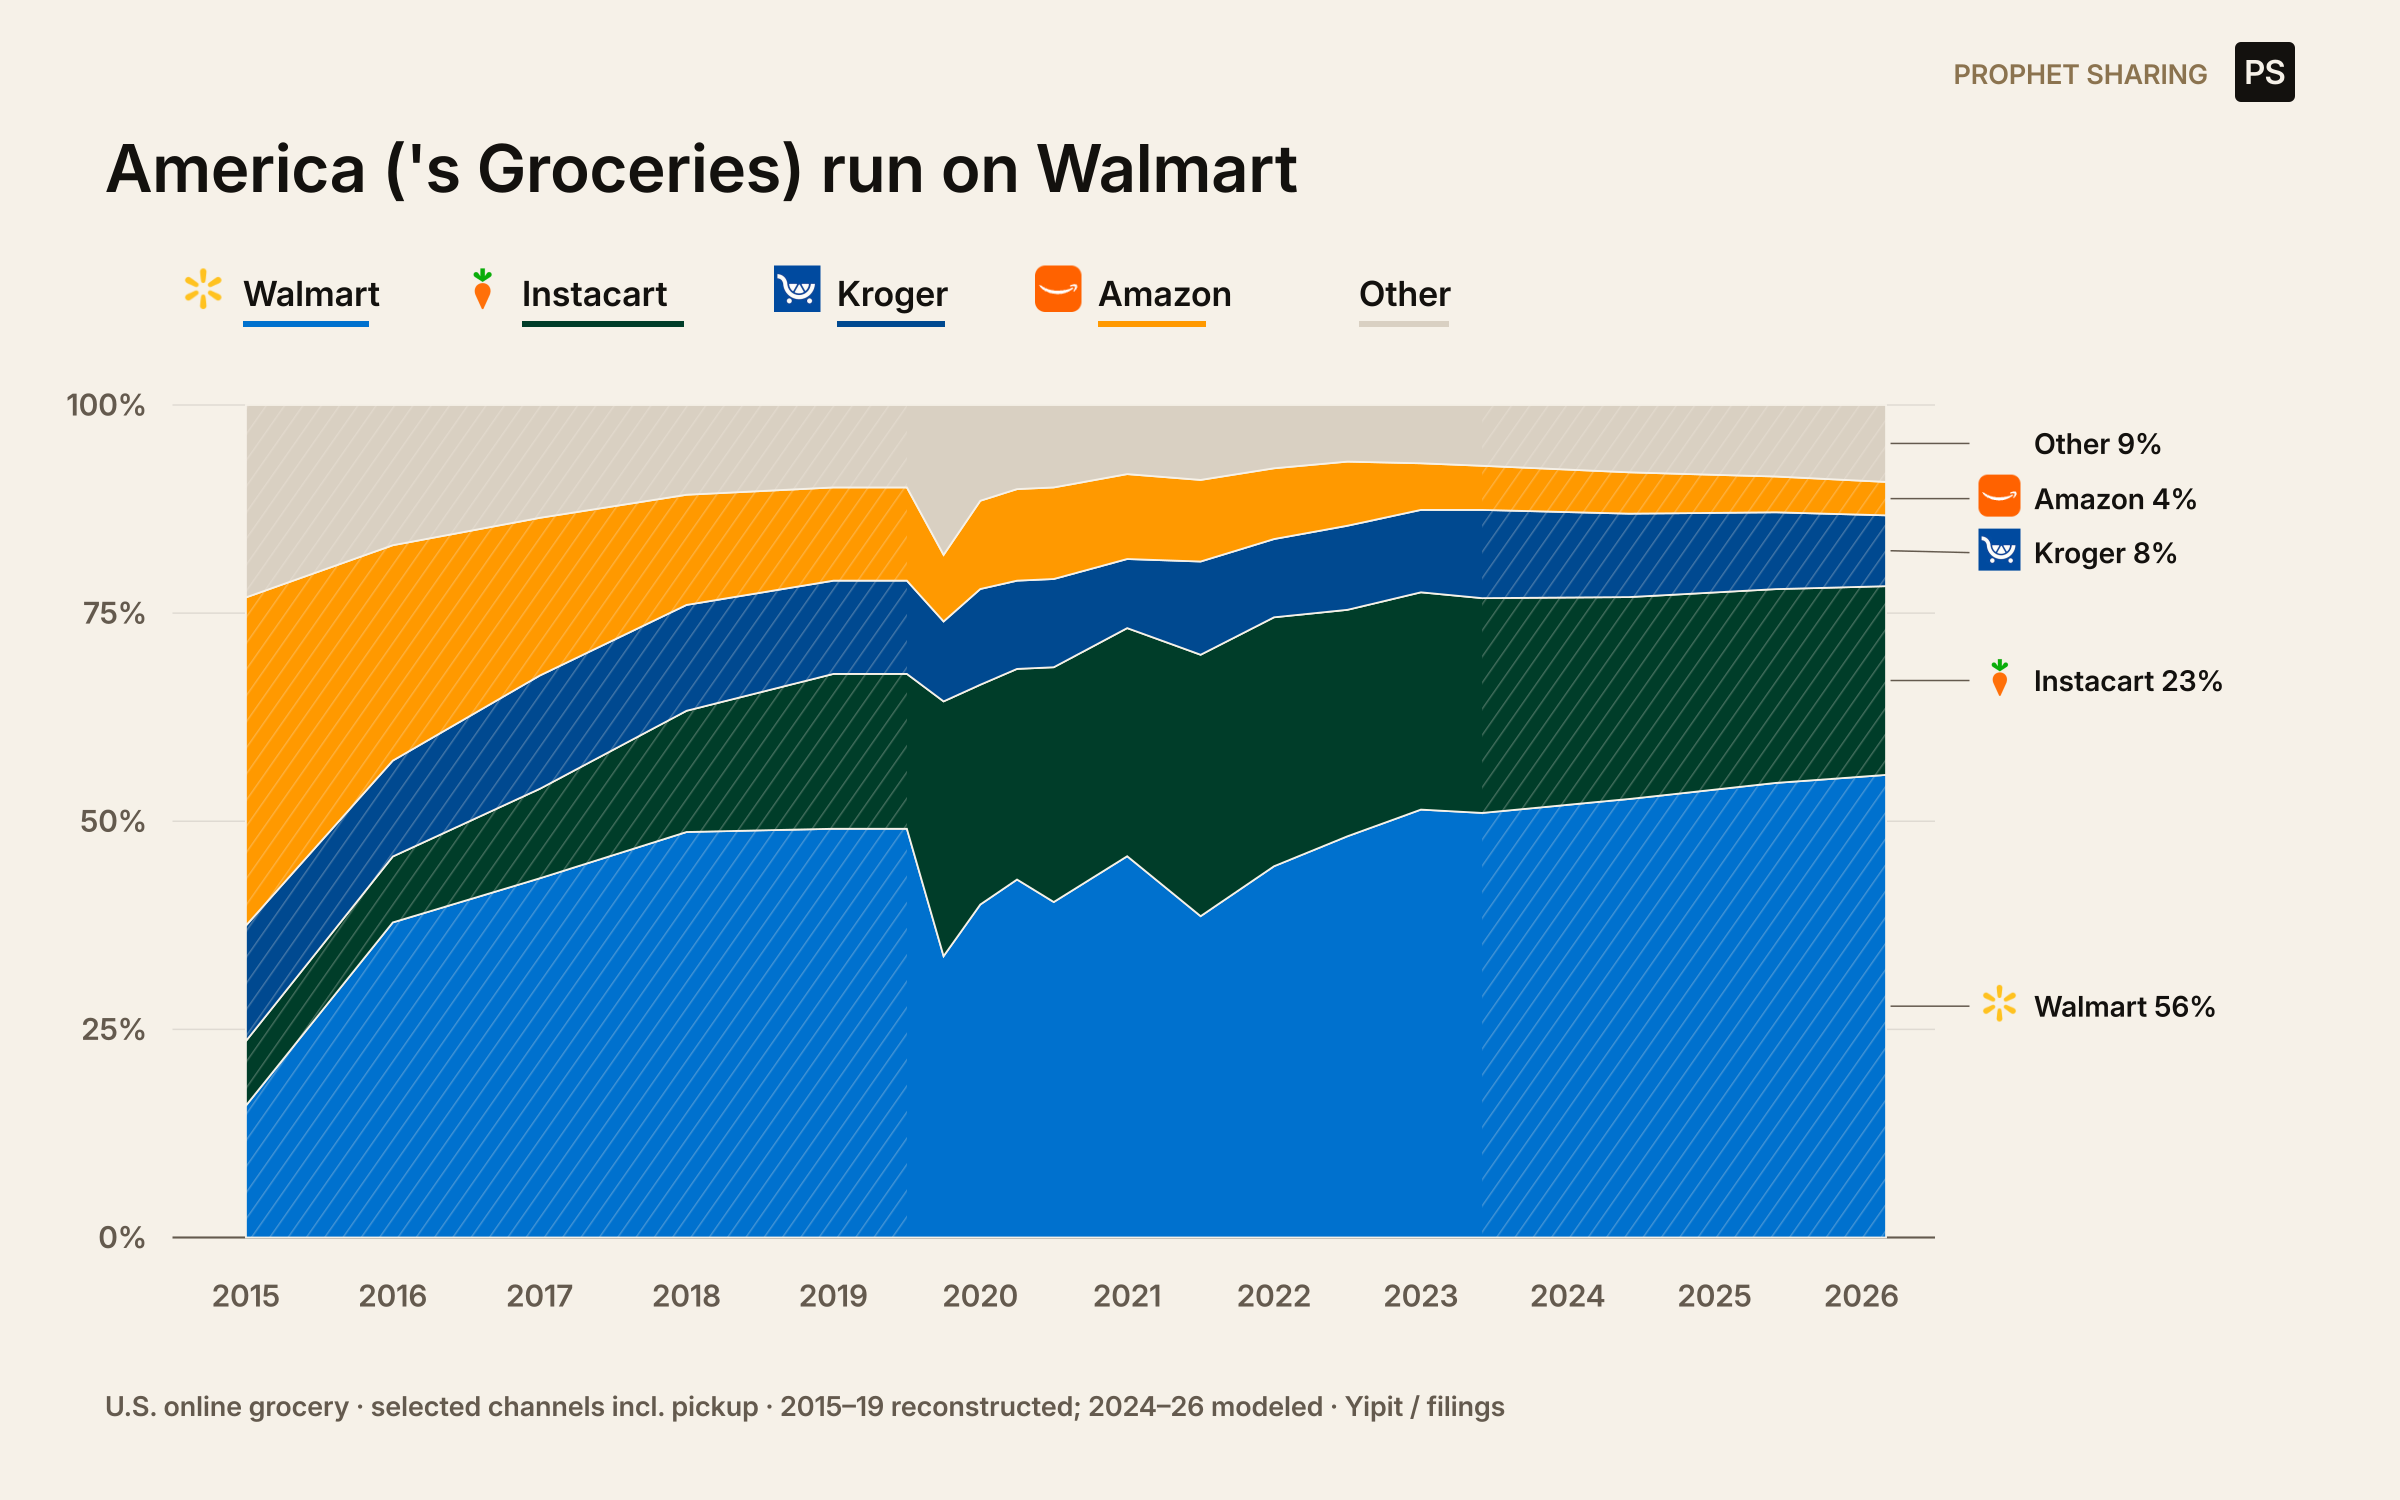
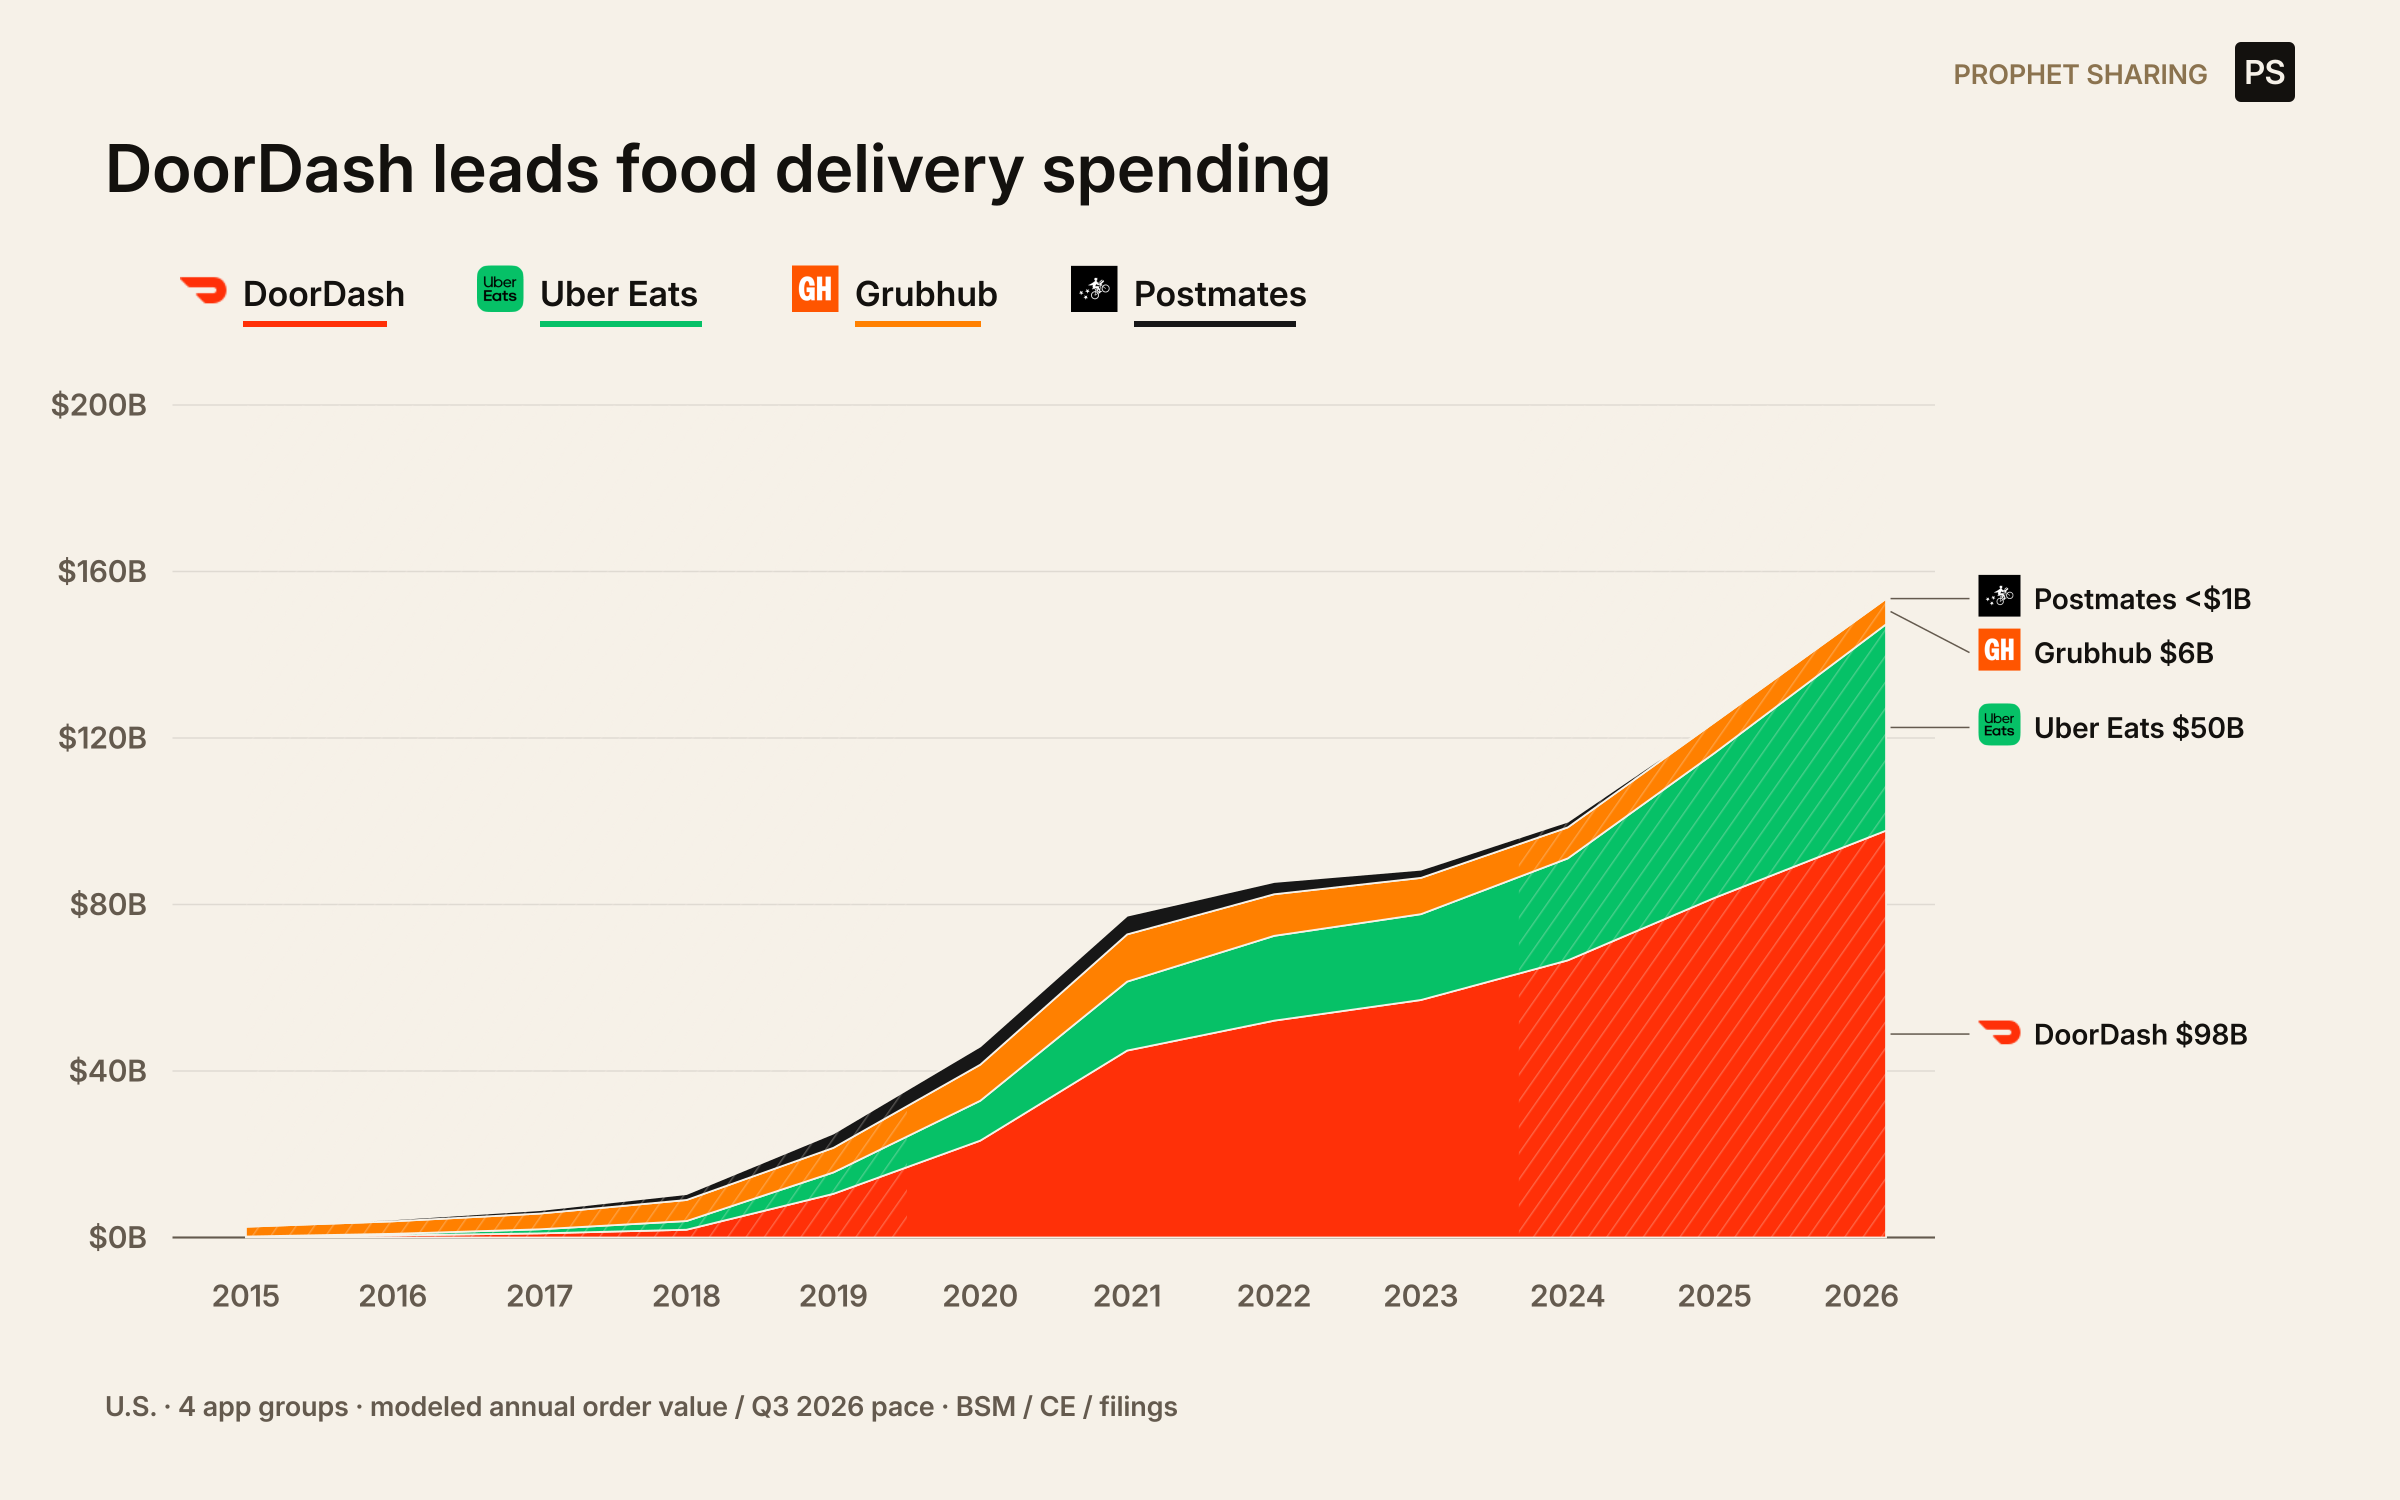
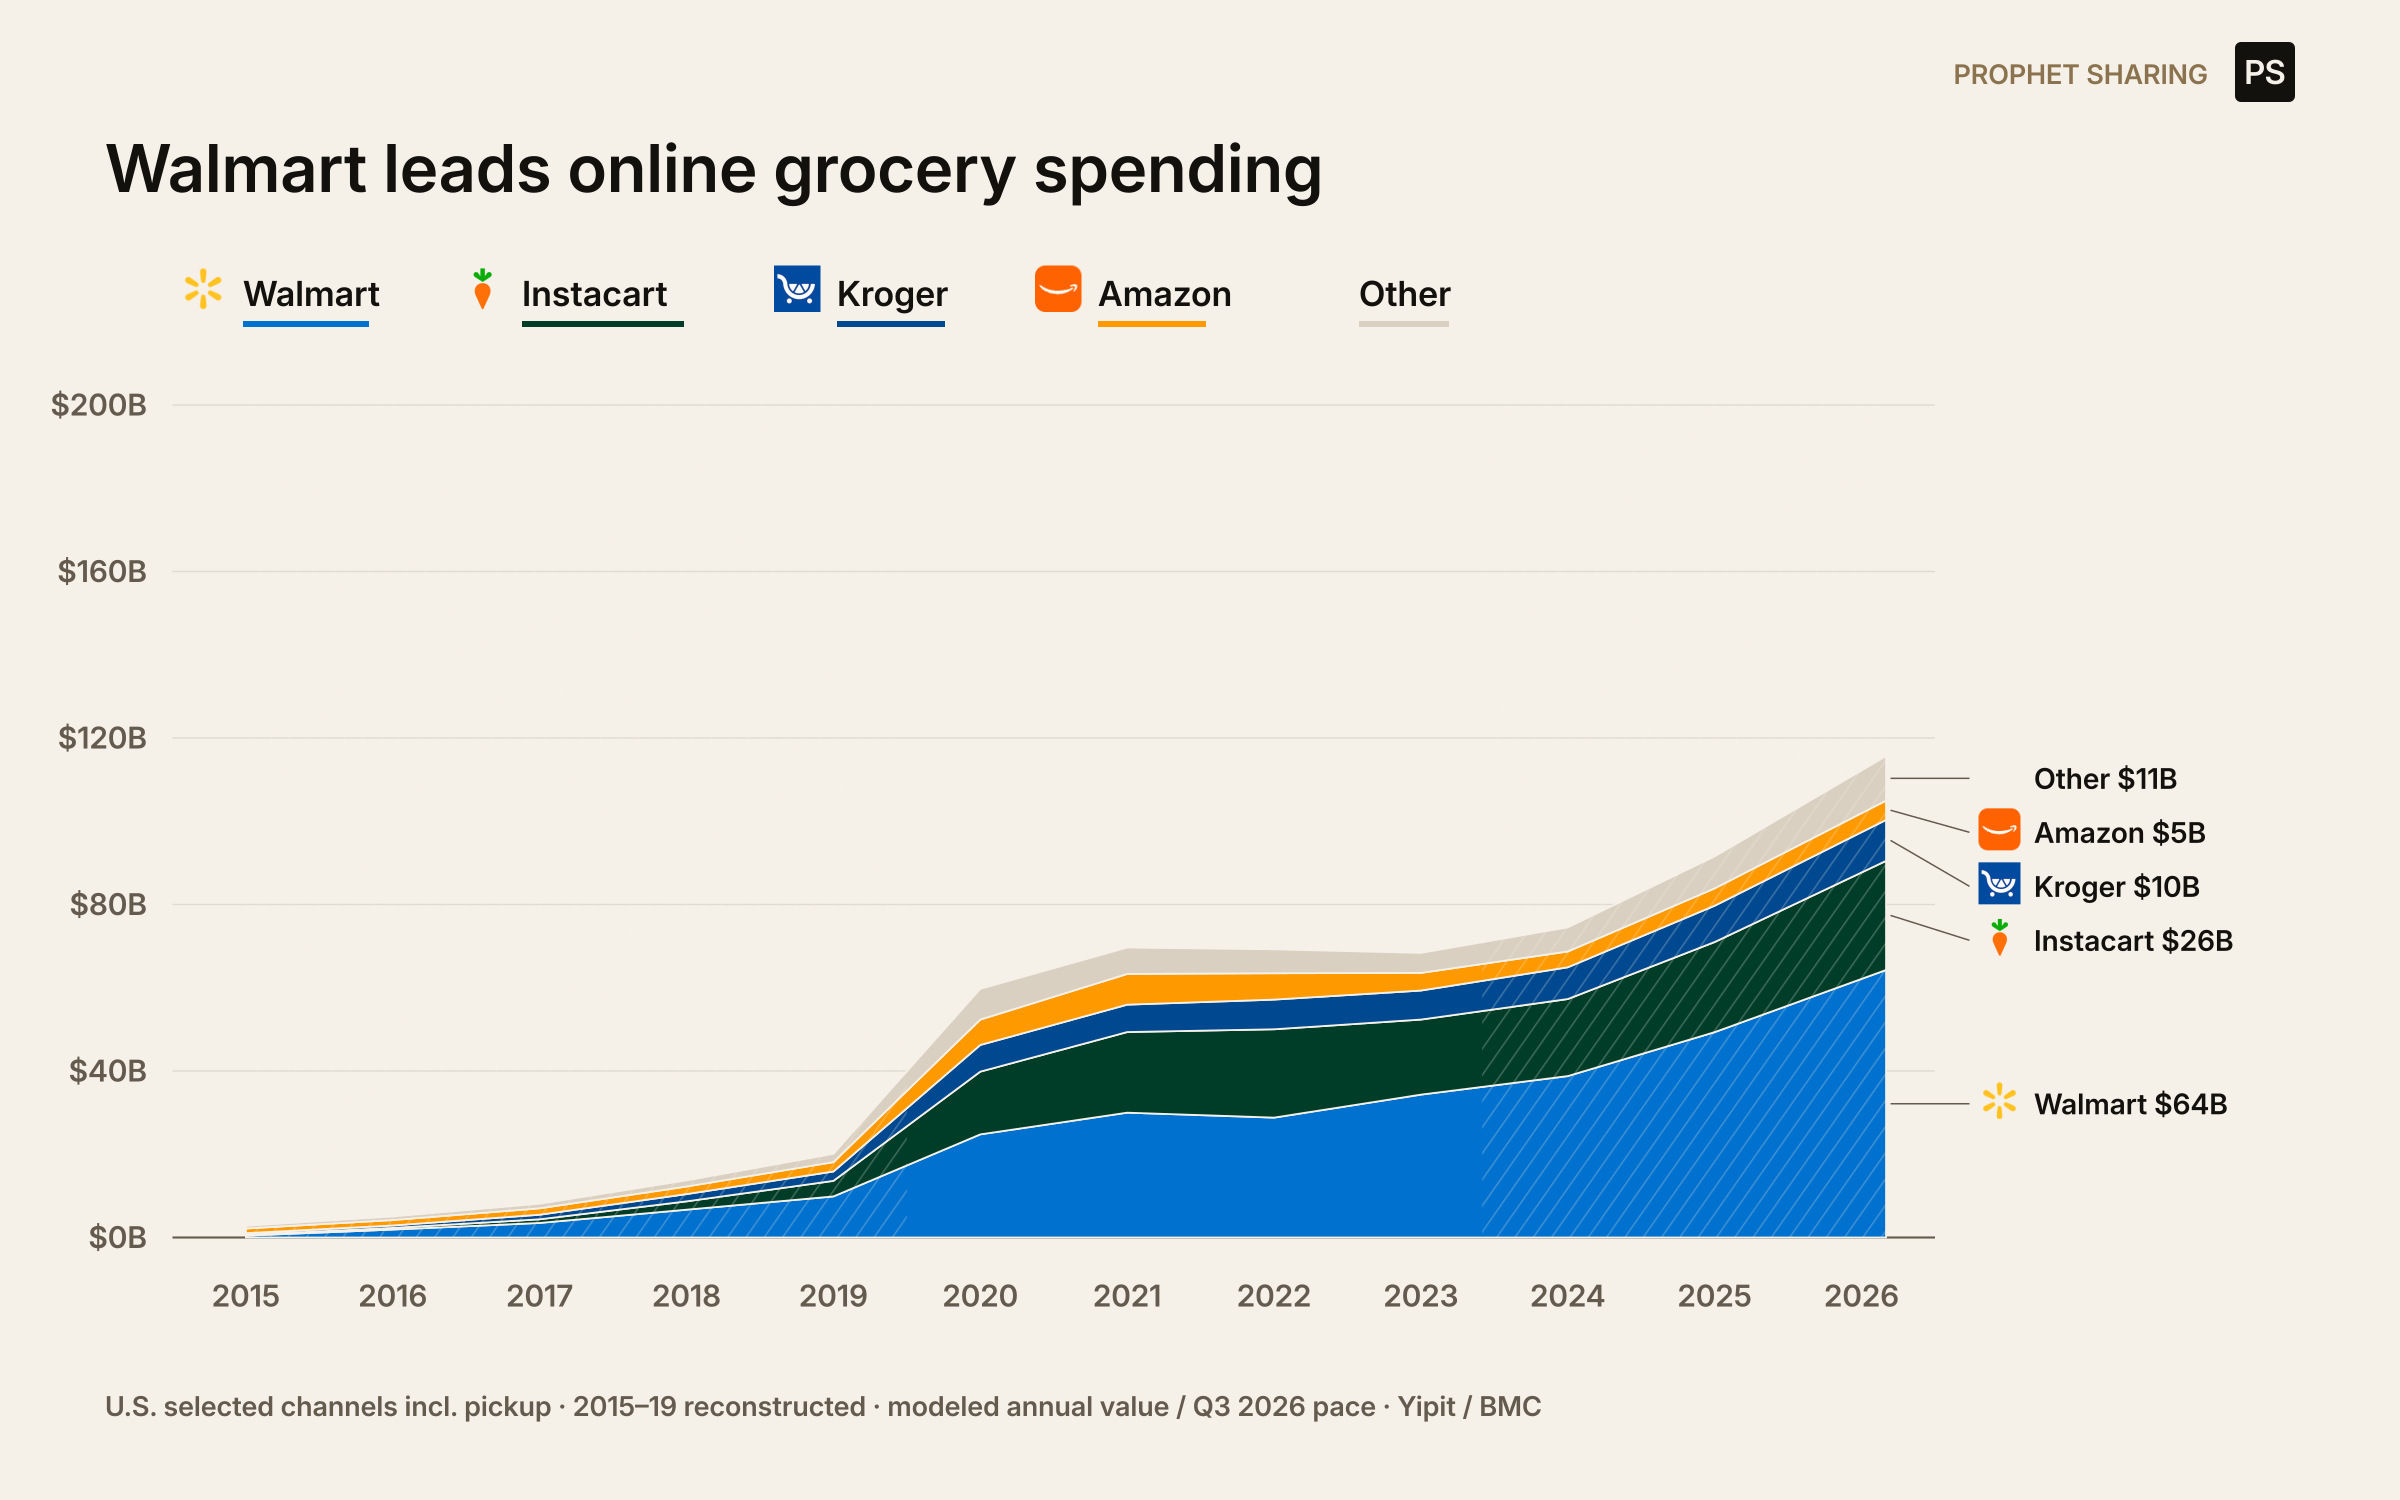
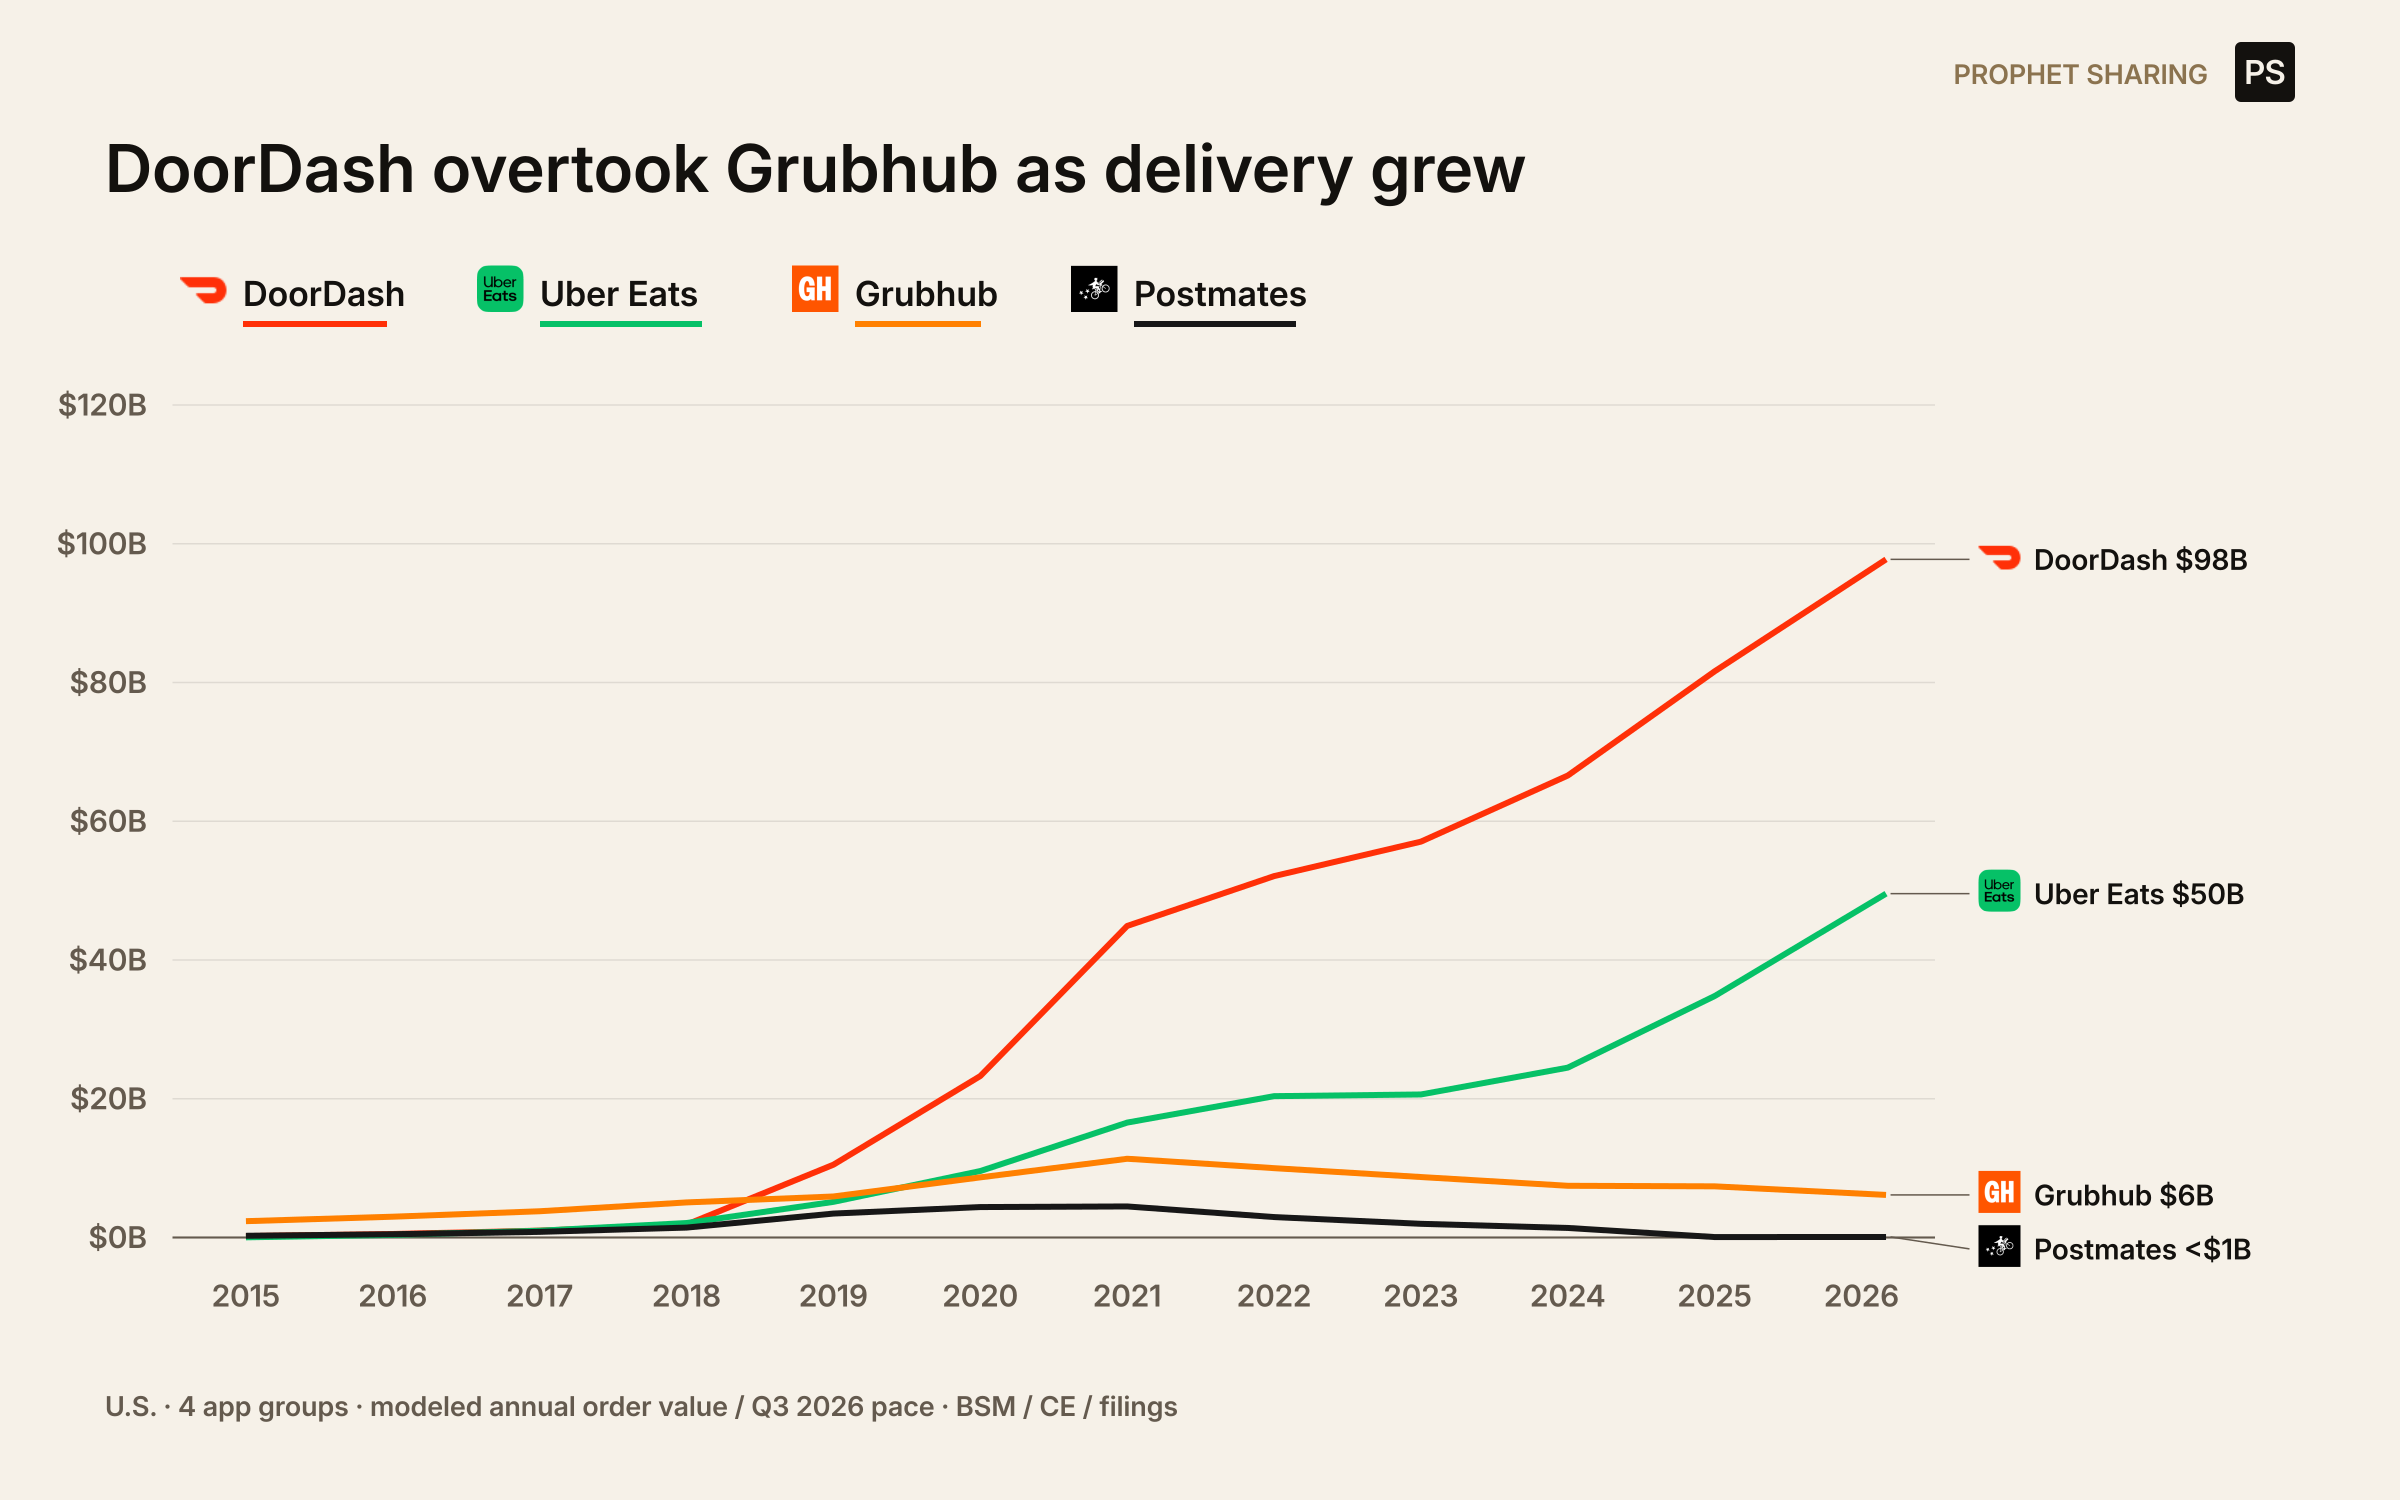
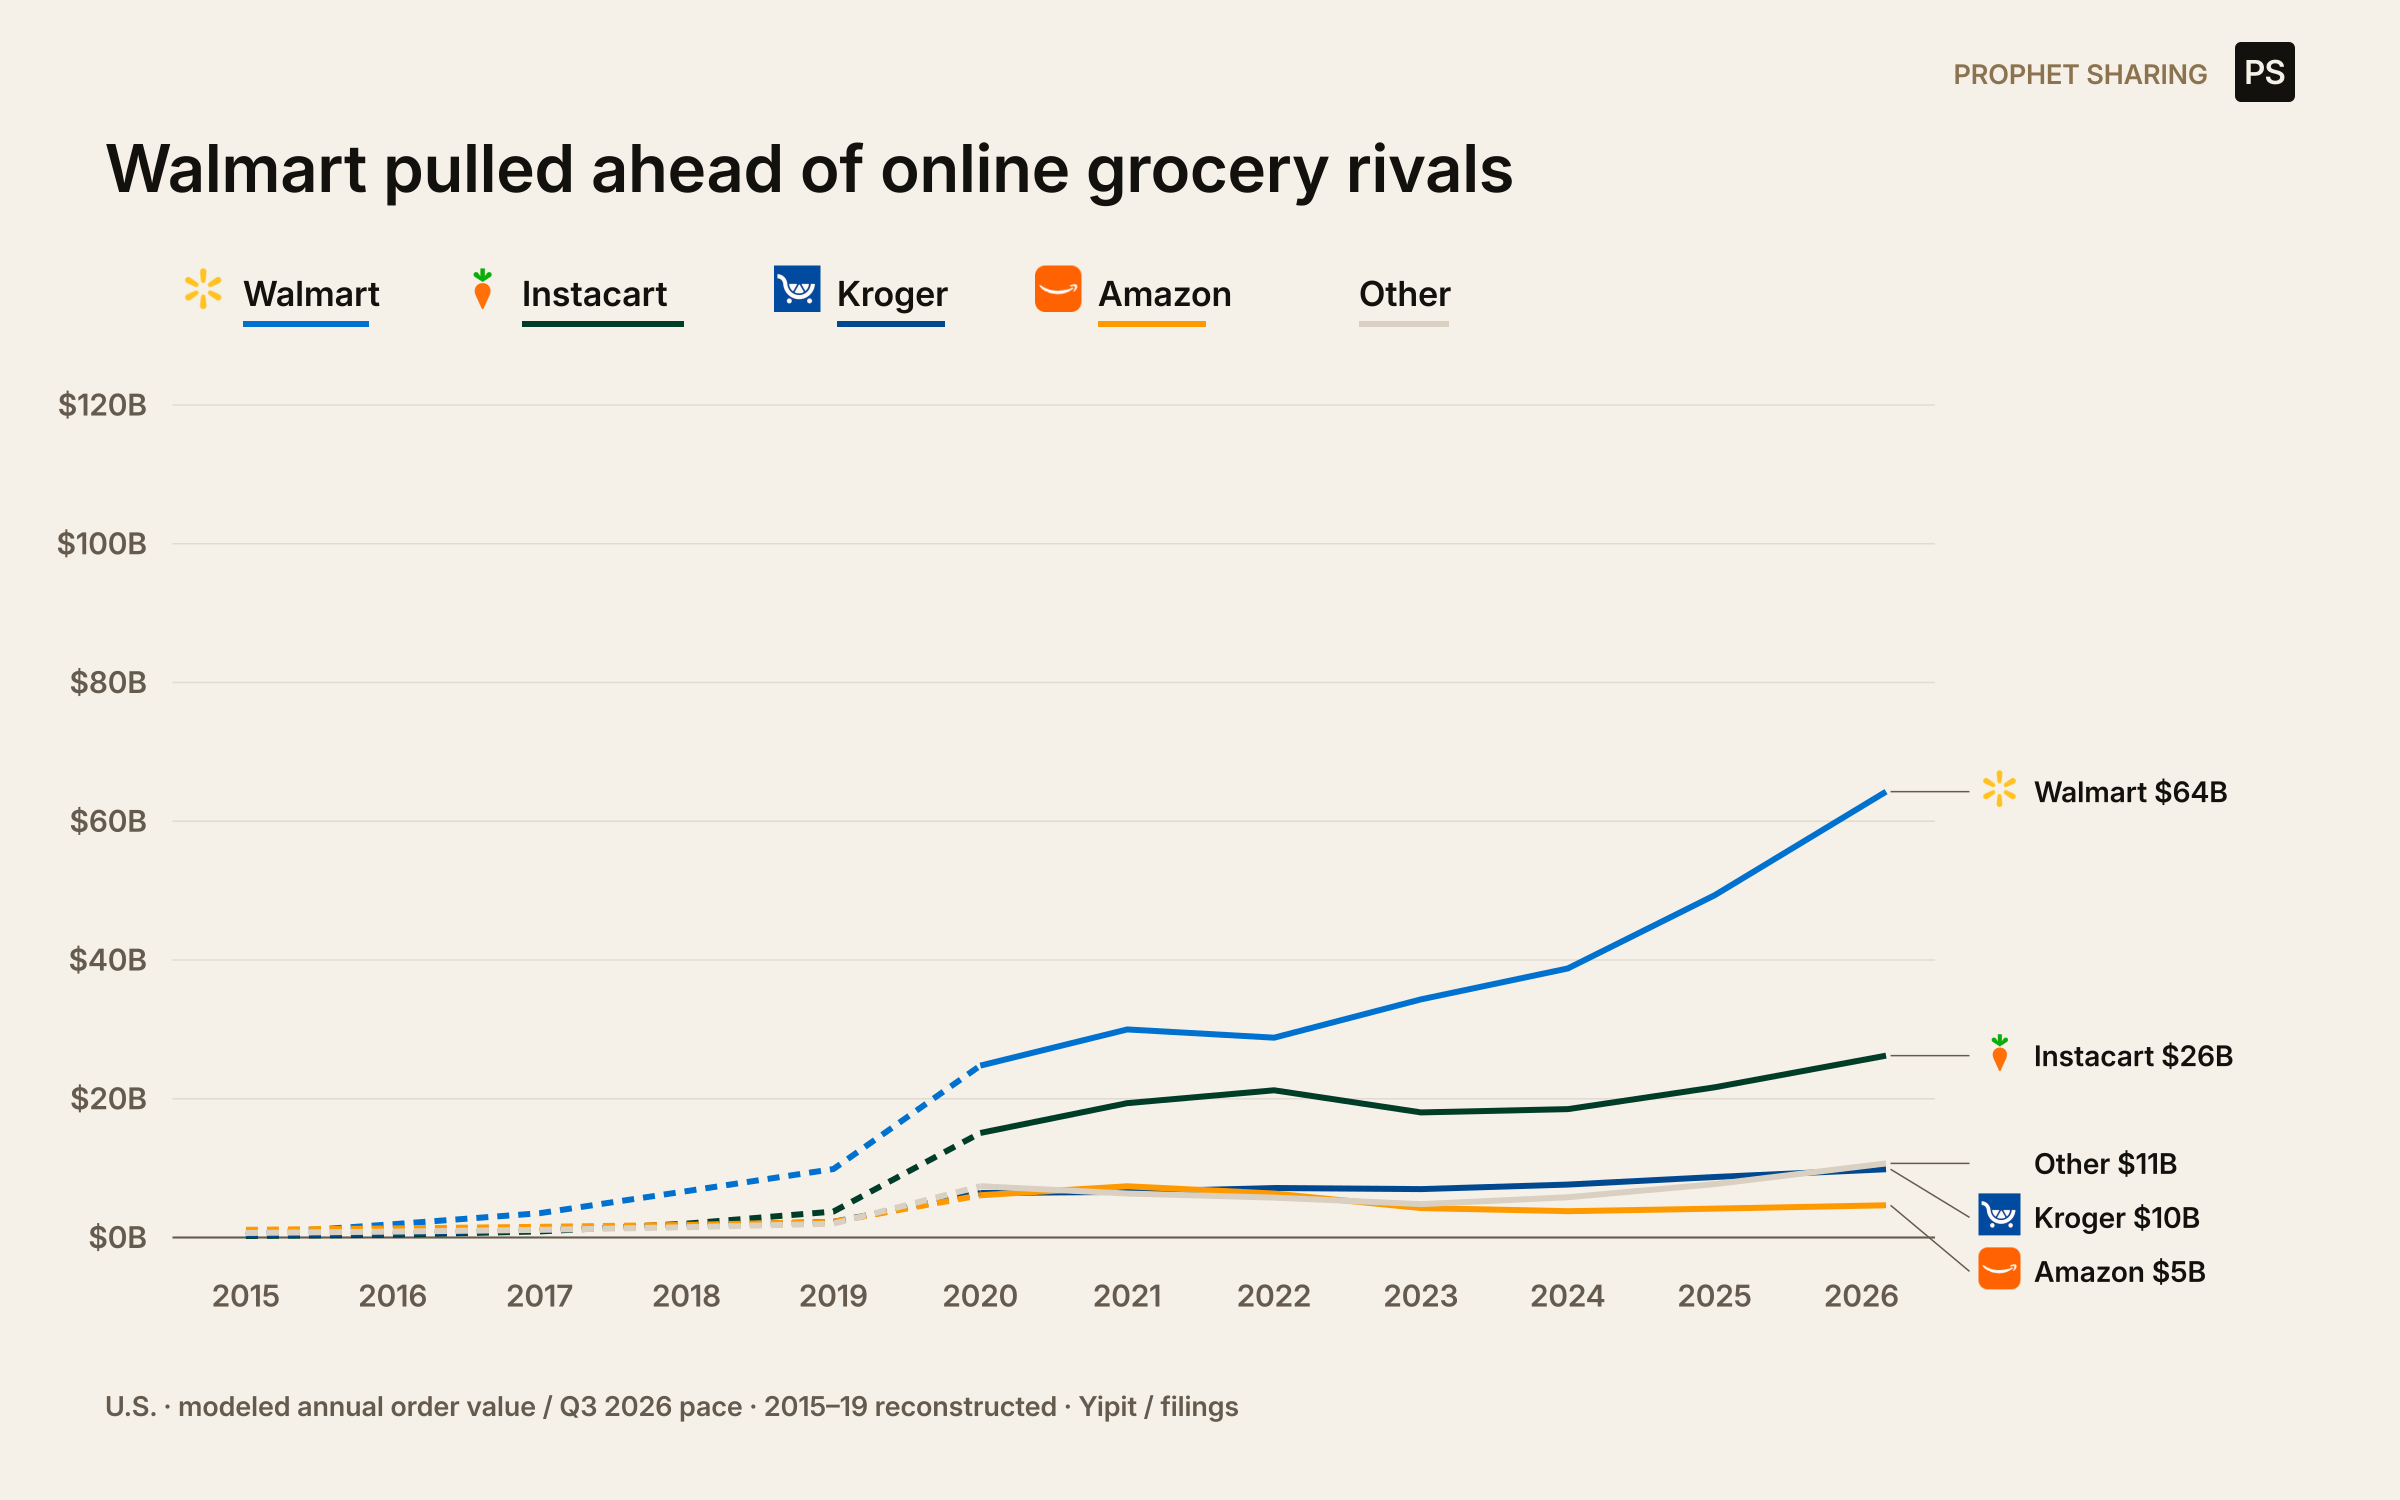
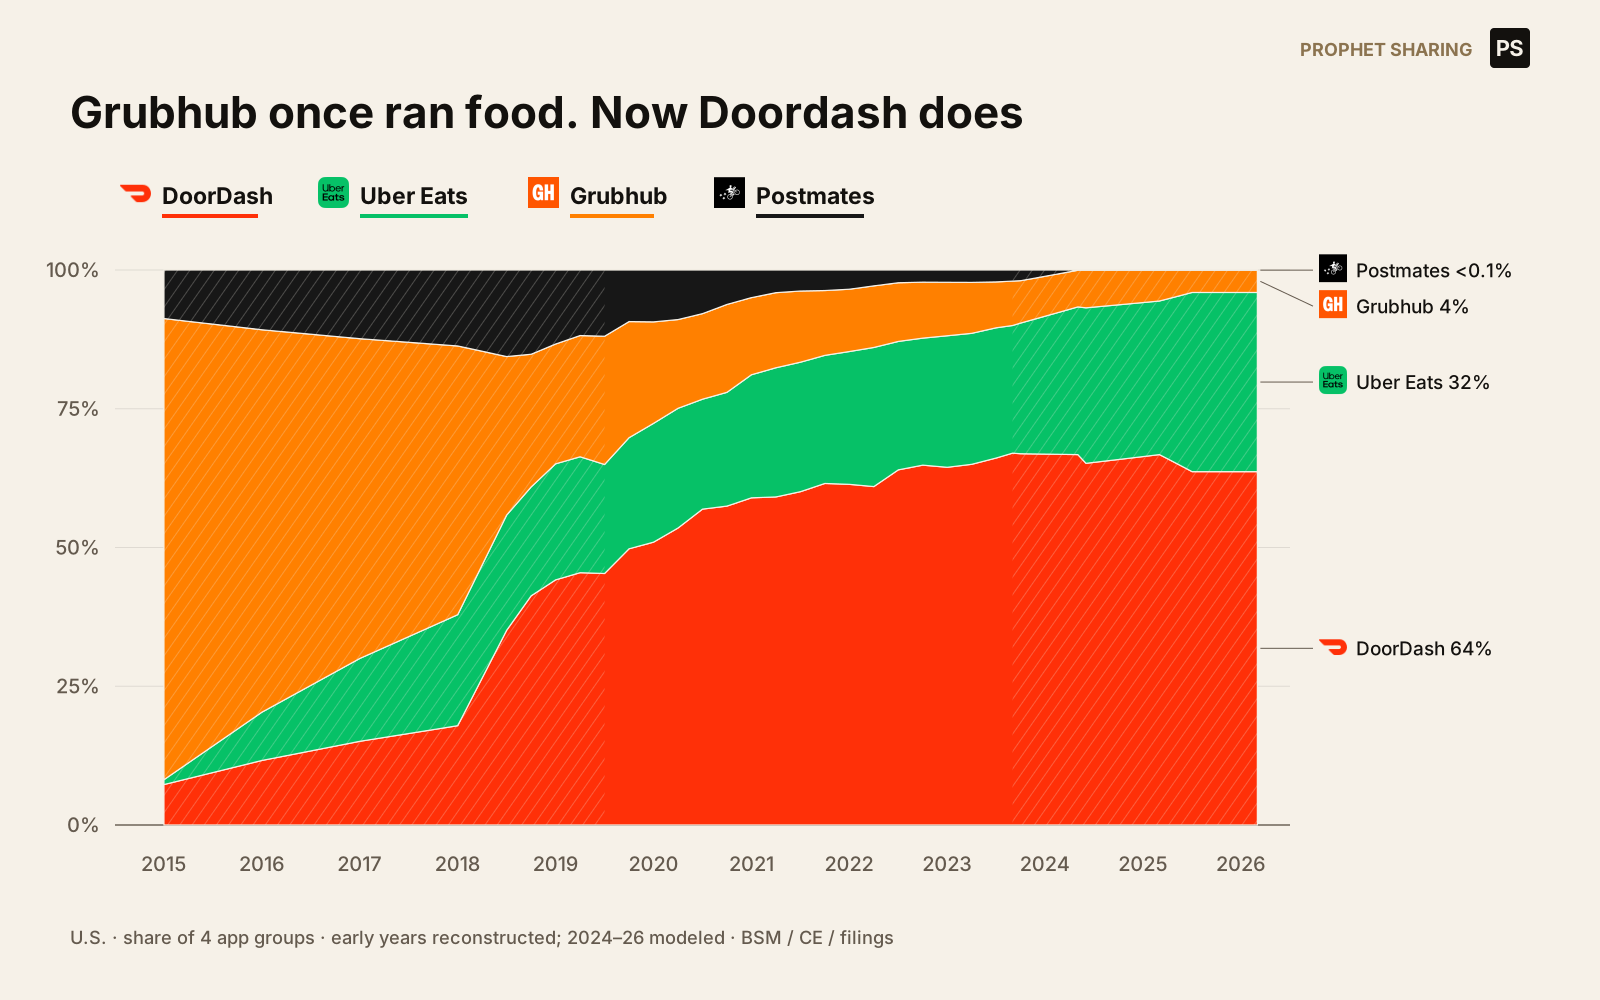
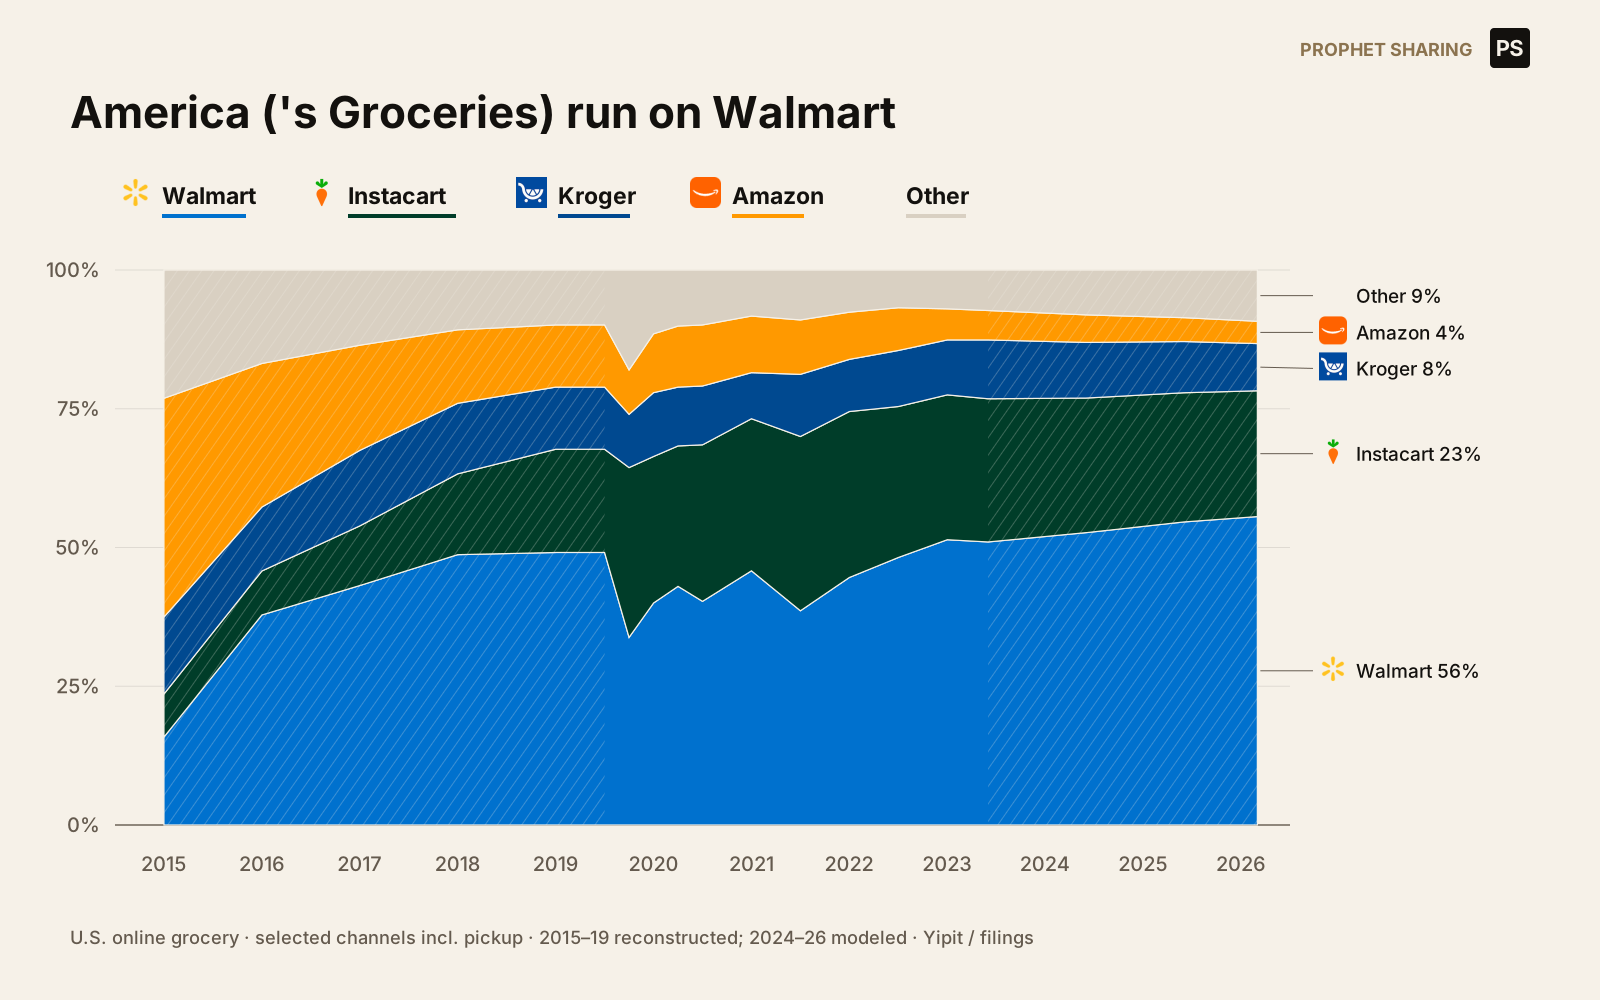
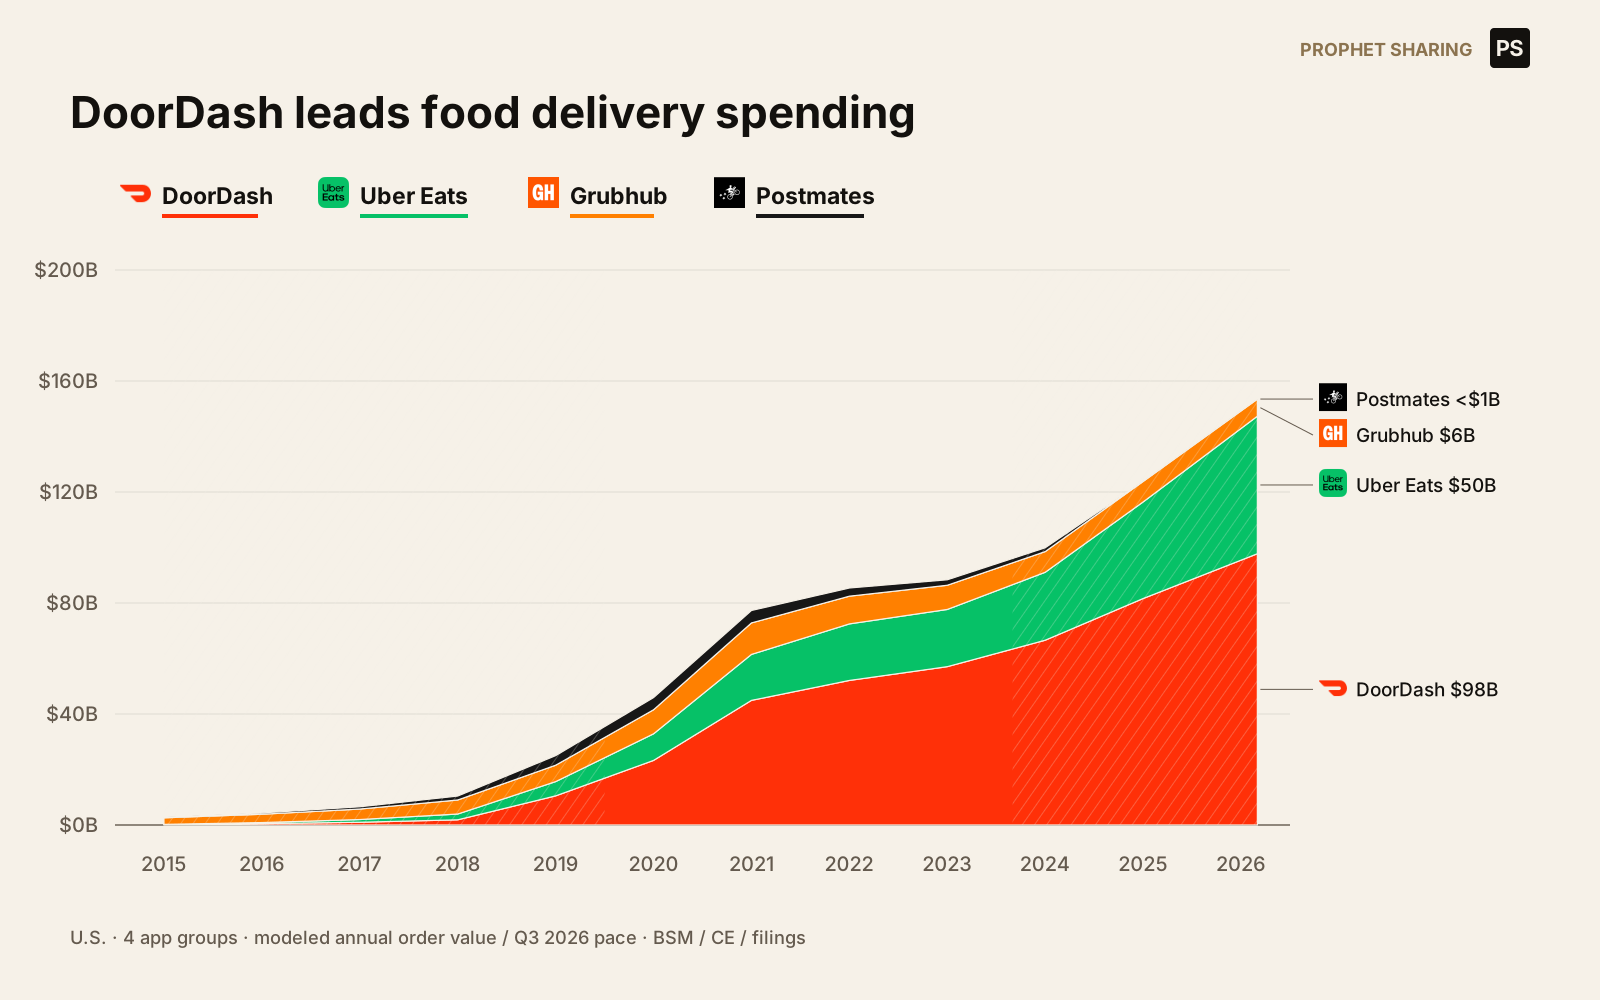
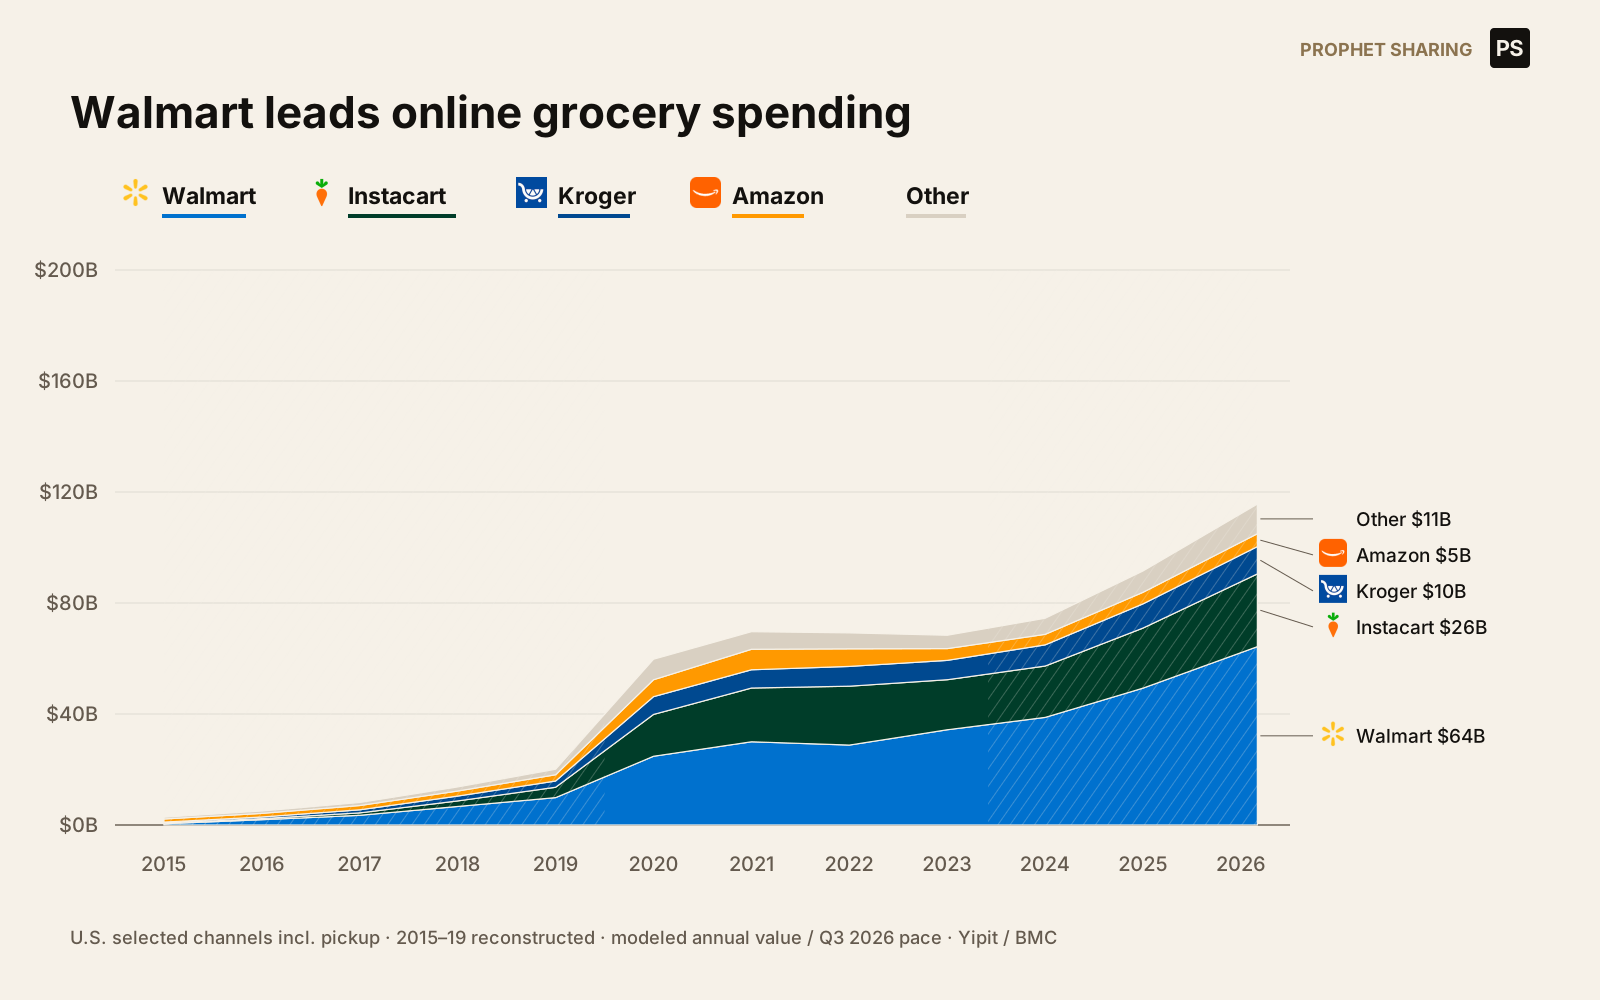
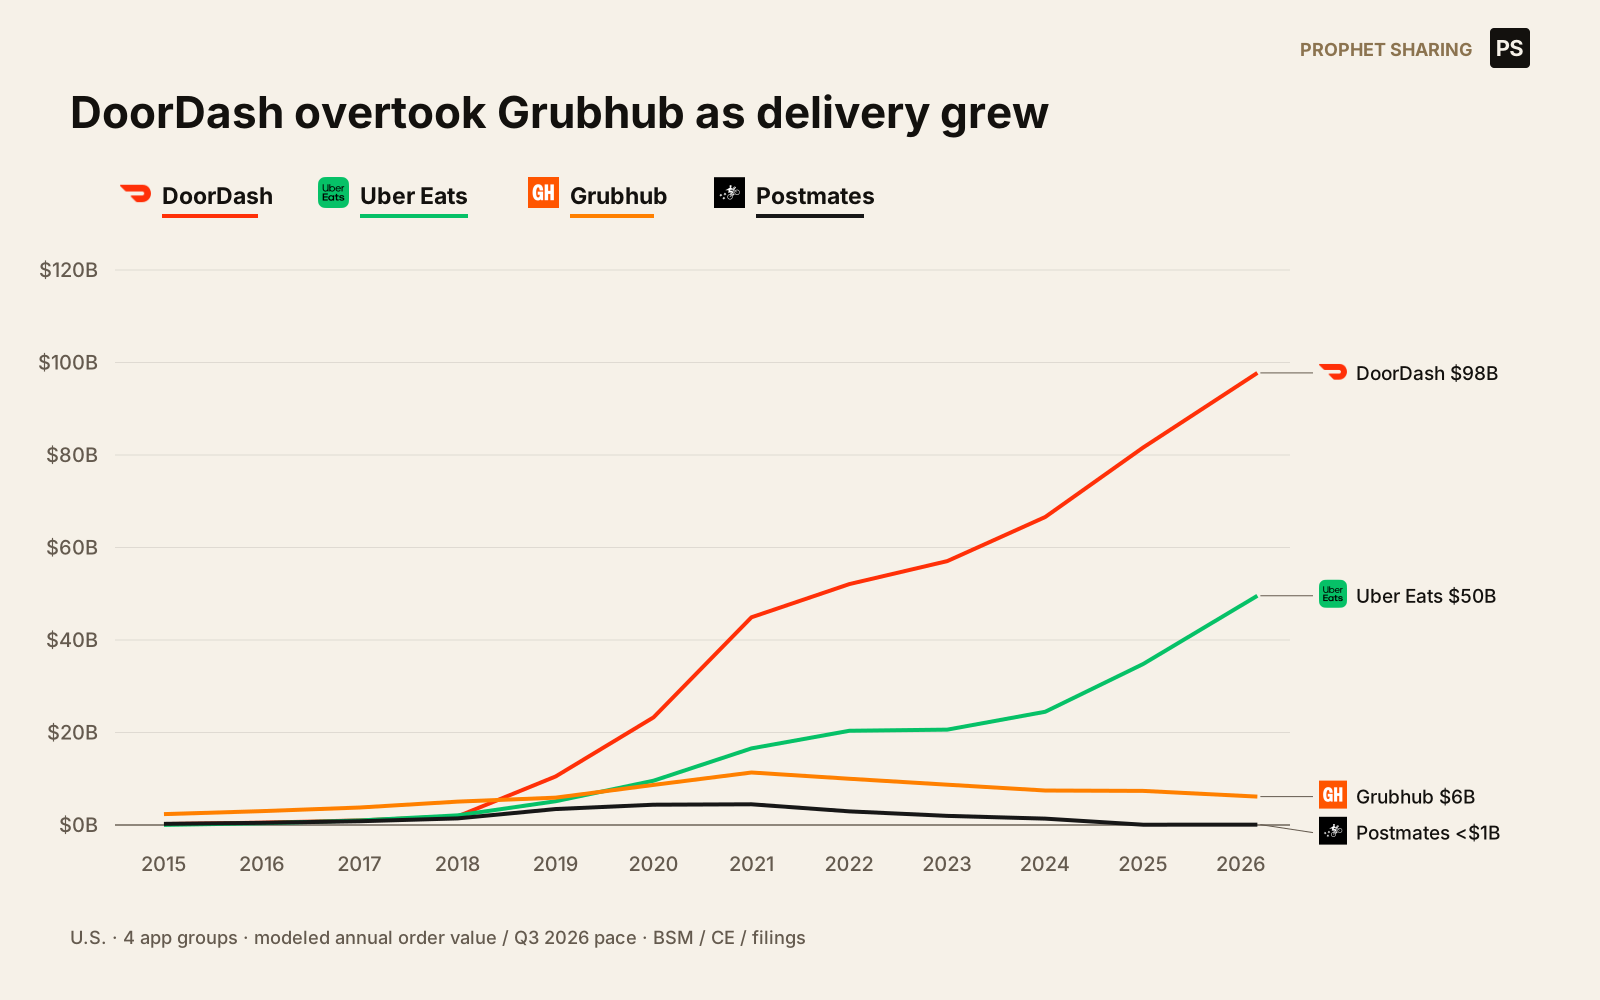
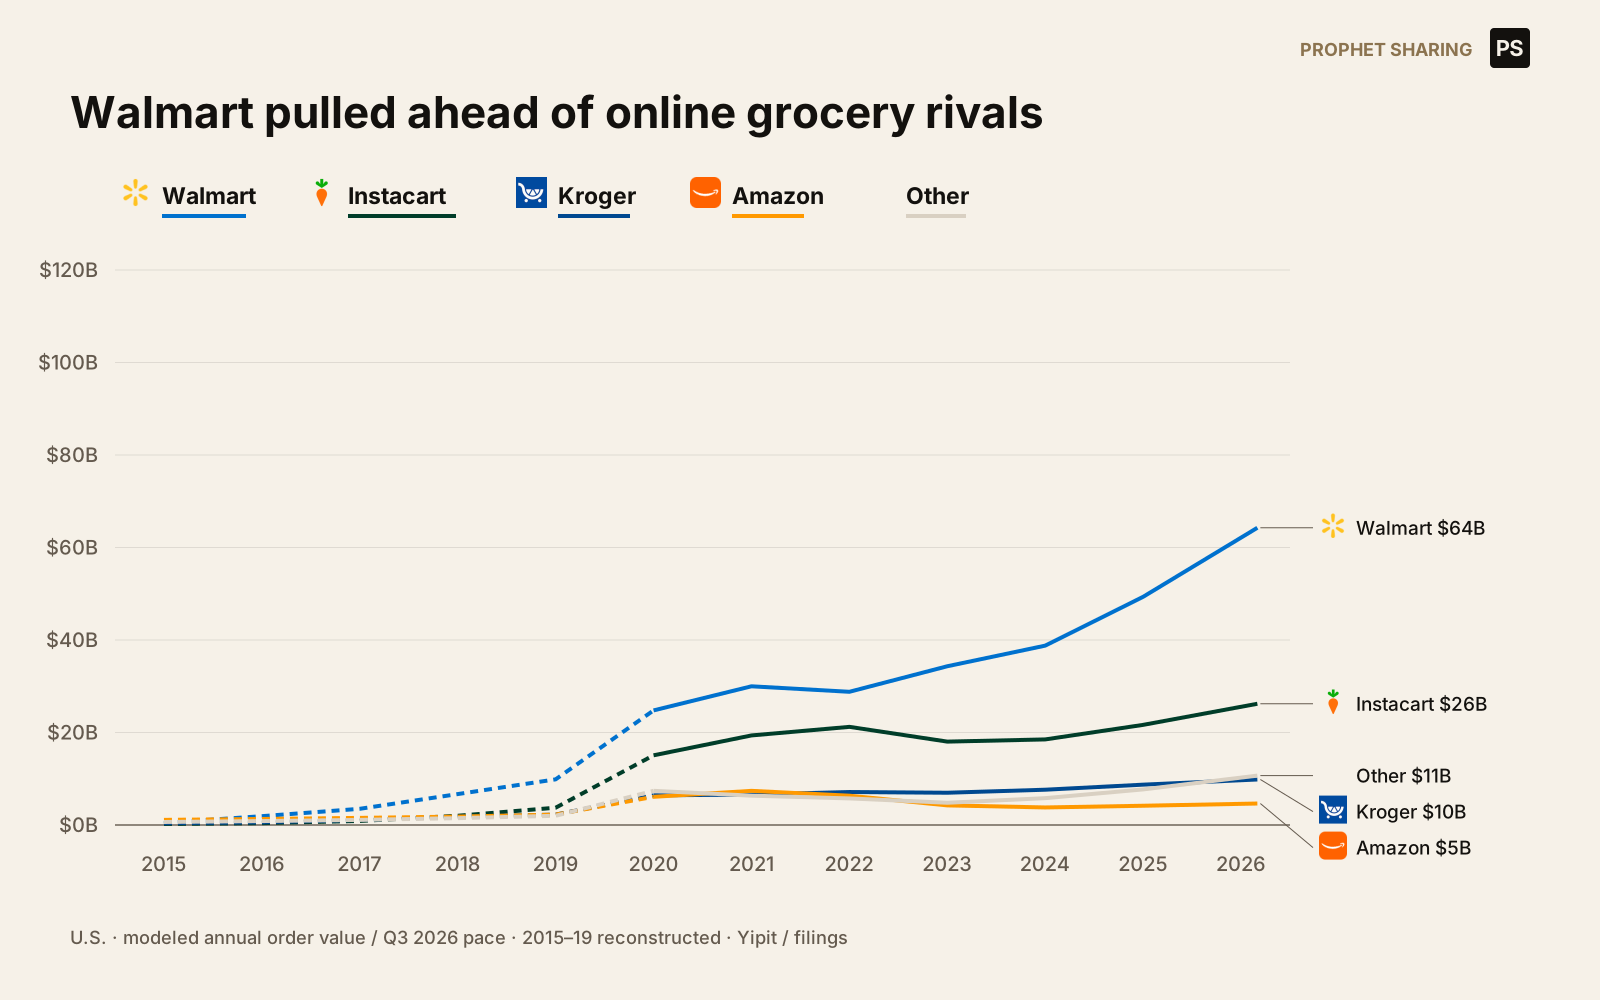
Food is the four displayed app groups, normalized to their subtotal. This excludes other platforms and restaurant-direct orders; some panel purchases include nonrestaurant goods. Grocery is the nine-channel Yipit ordering basket, grouped into five series, including pickup and shipping. Instacart Marketplace and Storefront are distinct; Storefront is in Other. The two markets overlap and must not be added.
The food share history uses the same Bloomberg April 2024 vintage through March 2024, followed by normalized Consumer Edge anchors. Published March 2024 endpoint labels (67%, 23%, 8%, 2%) take precedence over pixel ratios. The latest restaurant-only source is the January 2026 US Transact mix (63.7%, 32.3%, 4%); this mix is held through September instead of inventing further share movement. Postmates is a bounded 0.05% allocation, not a measured tiny share. CE Orion, Vela Gamma and US Transact changes are modeled joins, not measured company growth.
2015–2018 food shares are historical analyst reconstructions. In 2015 the source gives Grubhub 57% of its wider platform basket; excluding the 31.4% residual produces 83% among the four displayed apps. Neither is a share of all restaurant spending. Hatching identifies the early reconstruction and modern modeled extension. An independent Edison 2019 receipt panel corroborates the change in leadership but differs materially in levels; incompatible baskets are not averaged.
Grocery 2020–2023 is digitized from Yipit's original chart, with the stated Walmart 51% endpoint retained. 2015–2019 is backcast from Instacart's prospectus, Walmart pickup footprint, Kroger digital growth, Amazon relative growth and FreshDirect anchors, with wide sensitivity. 2024–2026 is modeled using company growth proxies, EMARKETER relative movement and BMC Walmart movement. Walmart's 56% endpoint belongs only to the selected-channel basket. BMC independently reports Walmart approaching 40% of all online grocery. The coverage conversion is calibrated to that BMC level, so the resulting agreement is not independent confirmation.
Dollar stacks and GMV lines use the same modeled calendar-year values through 2025. Share observations retain their source periods; annual dollar allocations use mean sampled quarterly shares or indices. 2019 and 2020 food scales now match Grubhub's disclosed annual gross food sales ($5.9136B and $8.669B); the prior 2020 scale was 14.7% too high. Modern food dollars still require assumed U.S. fractions of global DoorDash GOV. Grocery annual scale uses full-year BMC category totals and modeled selected-channel coverage. The 2026 endpoints are Q3 × 4 paces, not full-year actuals. Matching dollar axes are $0–200B; GMV-line axes are $0–120B.
Latest modeled food mix is 64% DoorDash, 32% Uber Eats and 4% Grubhub after rounding. Grocery selected-channel mix is 56% Walmart, 23% Instacart, 8% Kroger, 4% Amazon and 9% Other. These are not observed September 2026 company-share measurements. The retained sensitivity ranges preserve both leaders but do not establish exact point shares. Full inputs, alternatives, source roots and definition limits are in the audit.
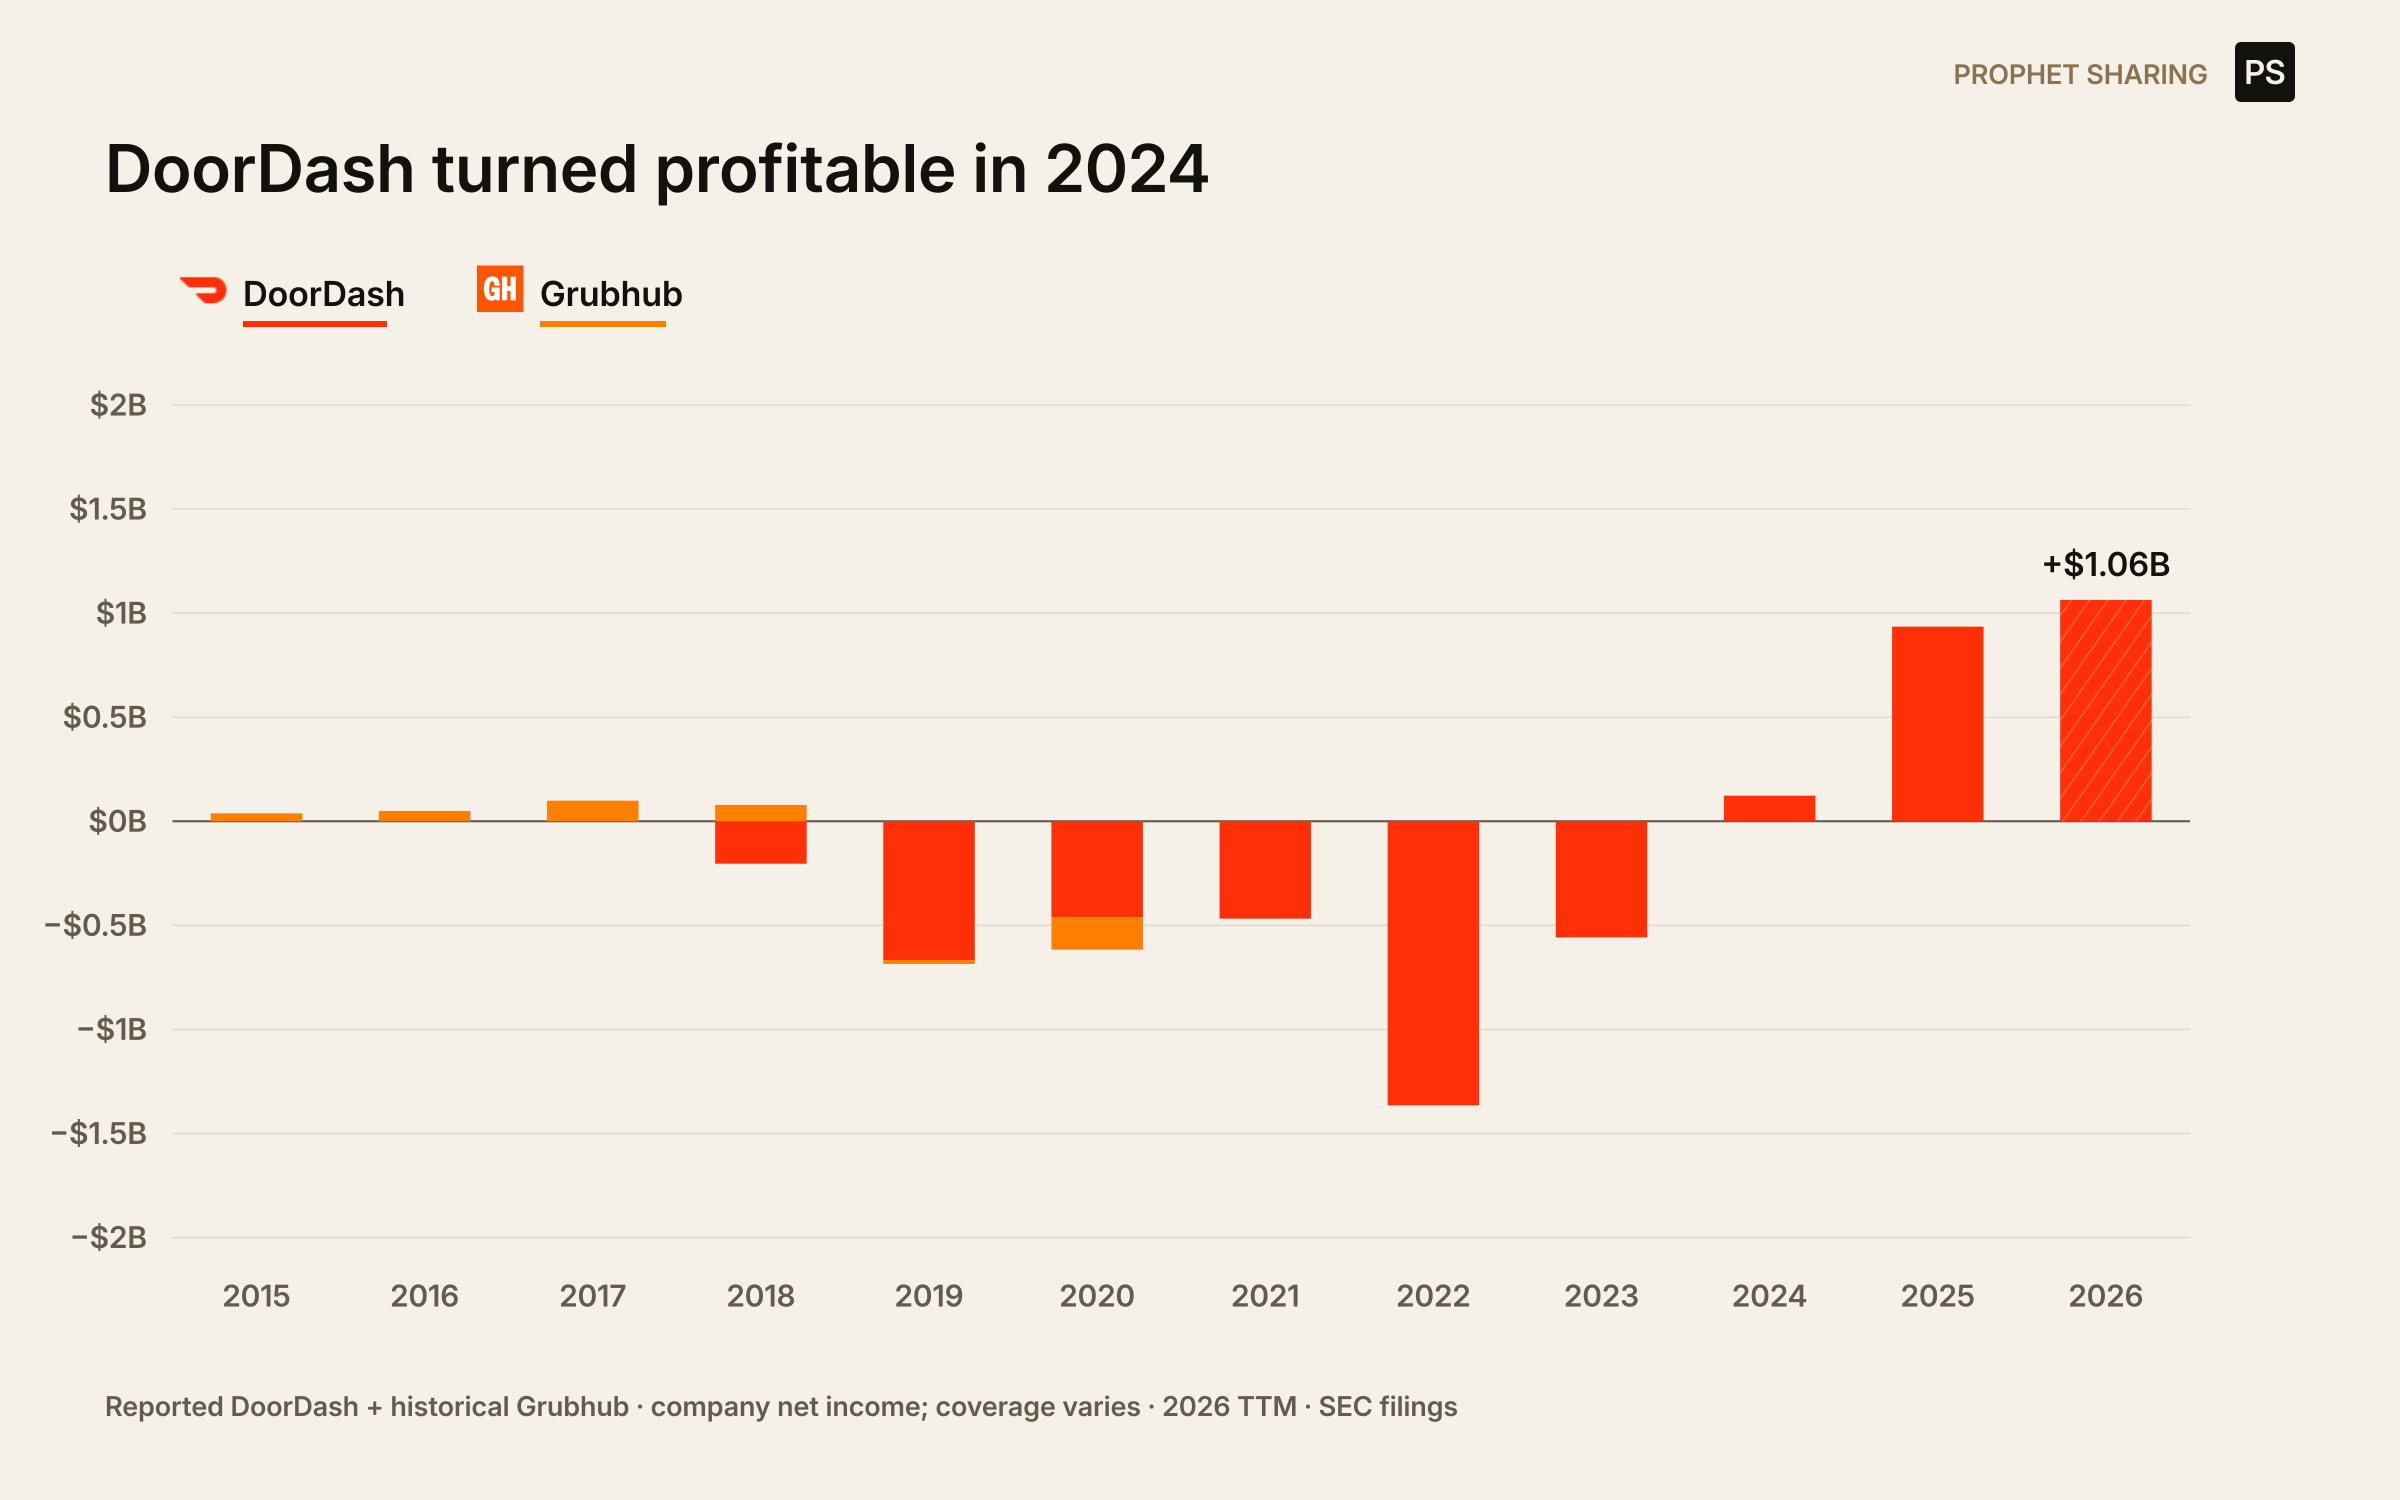
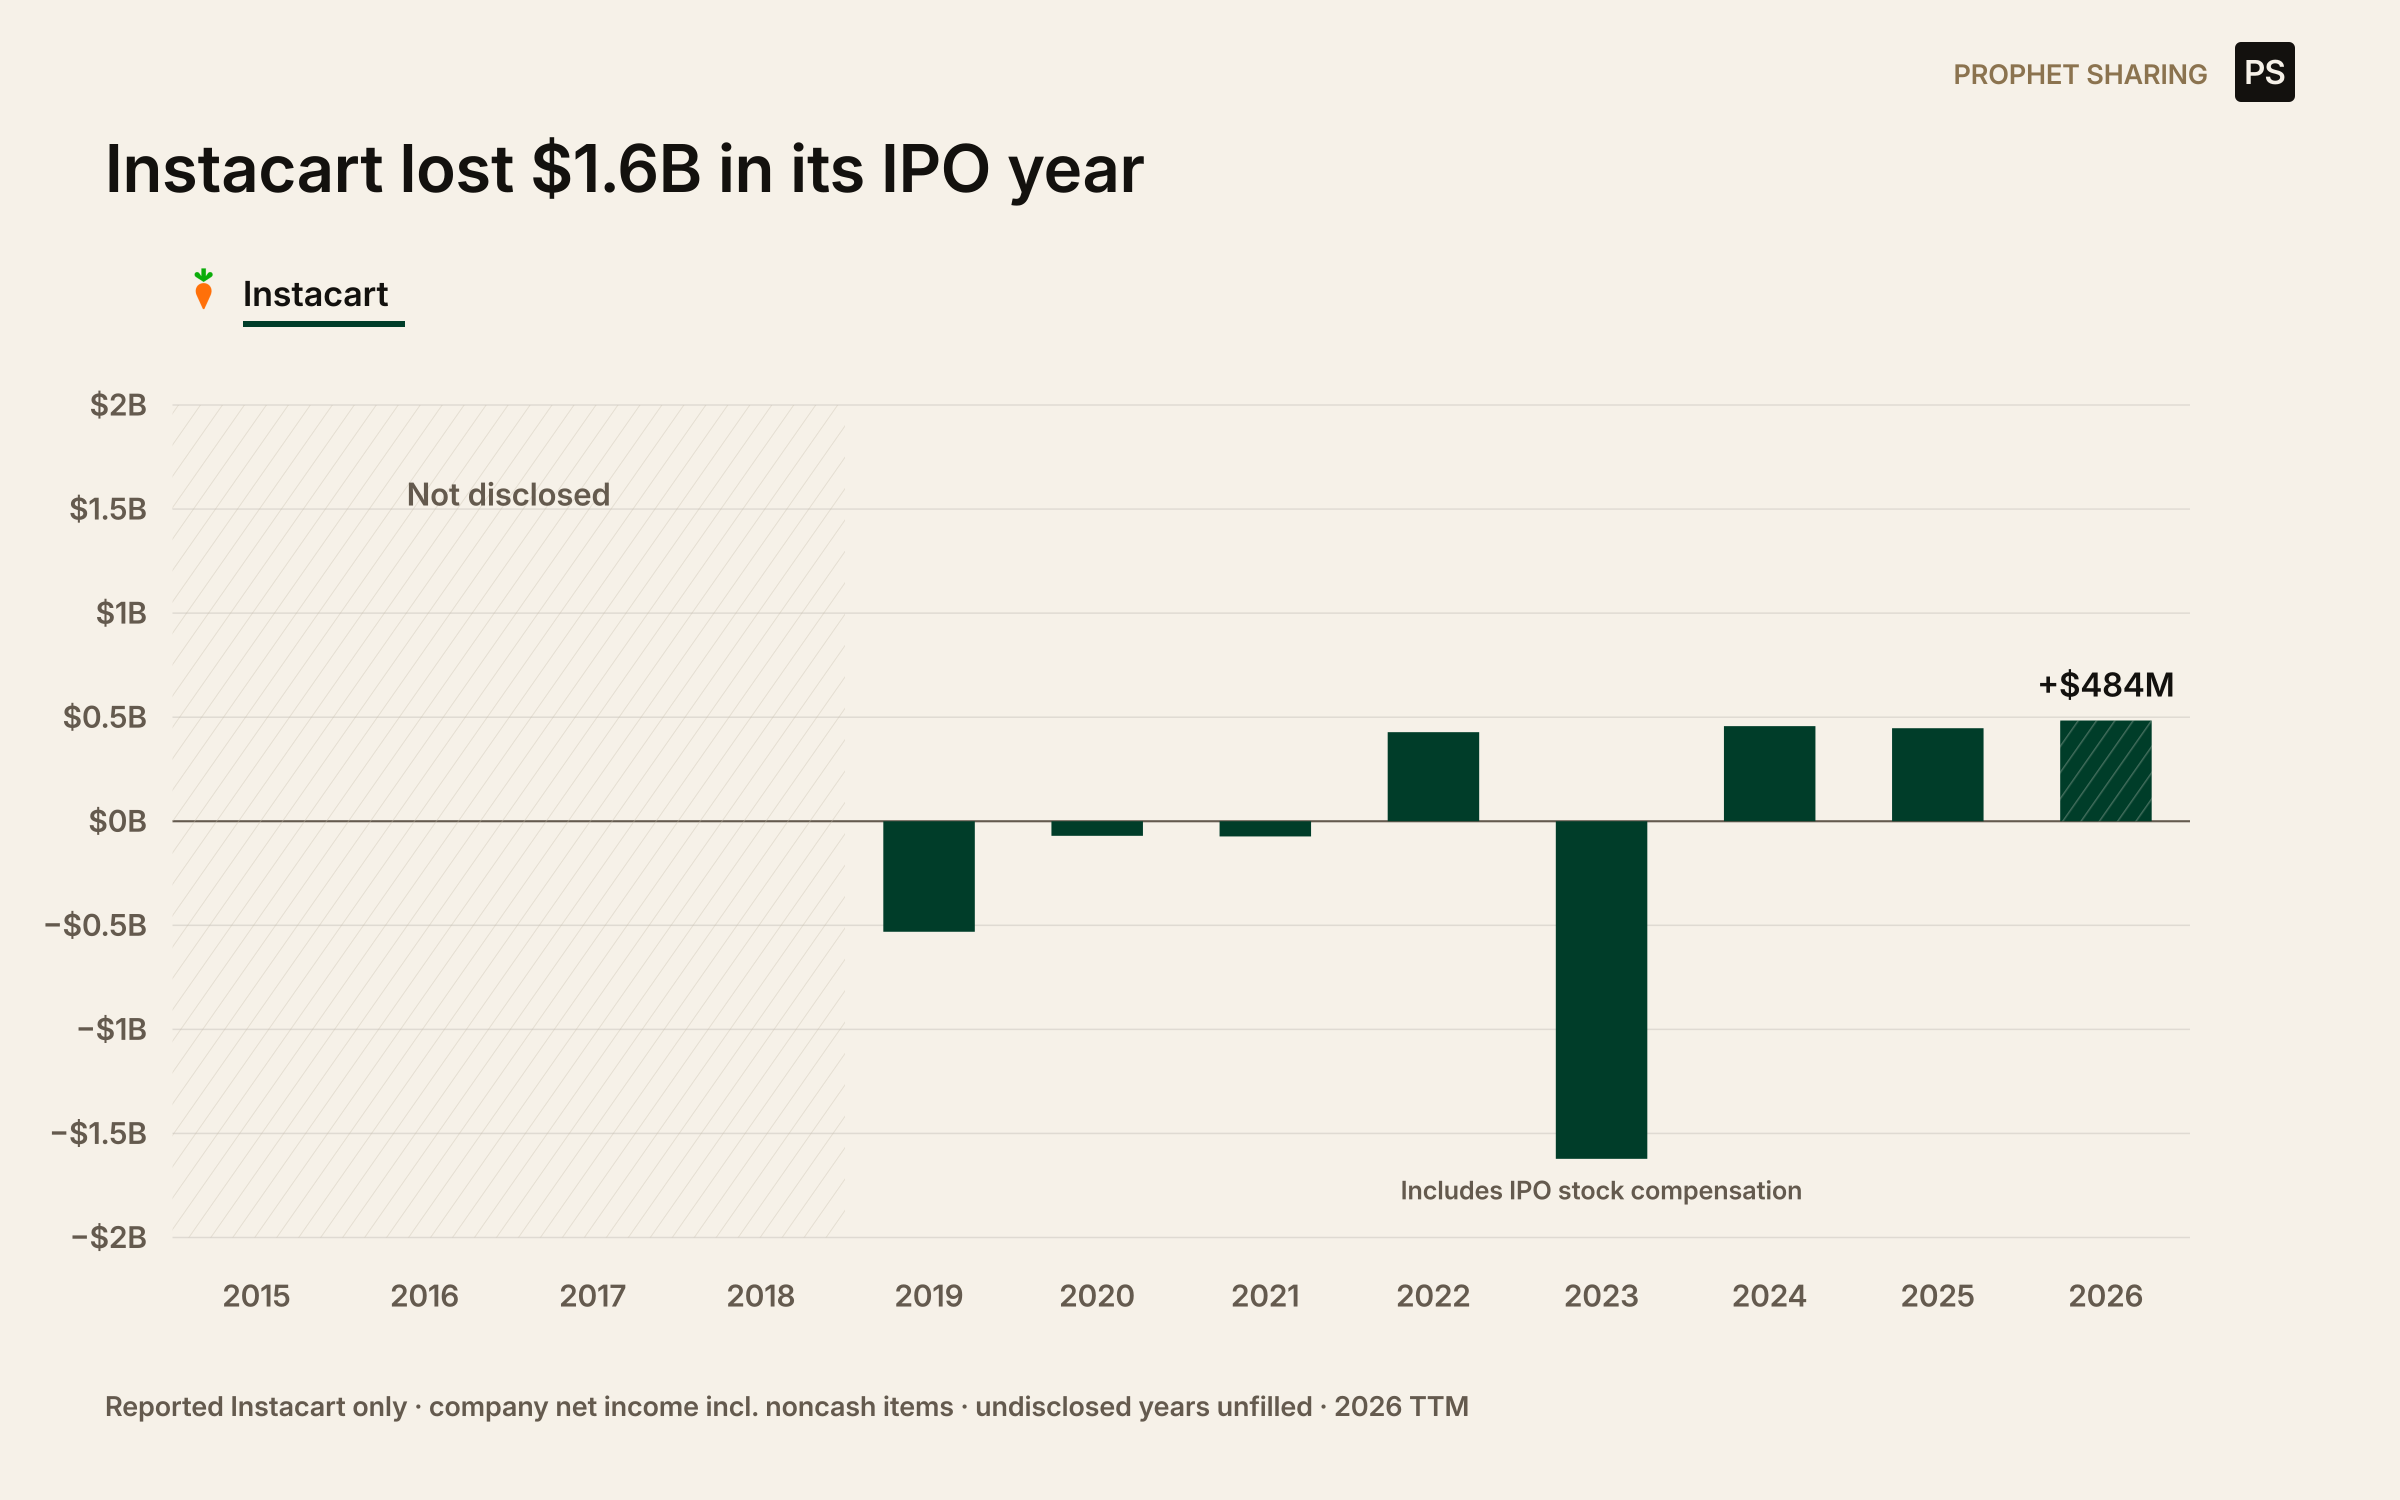
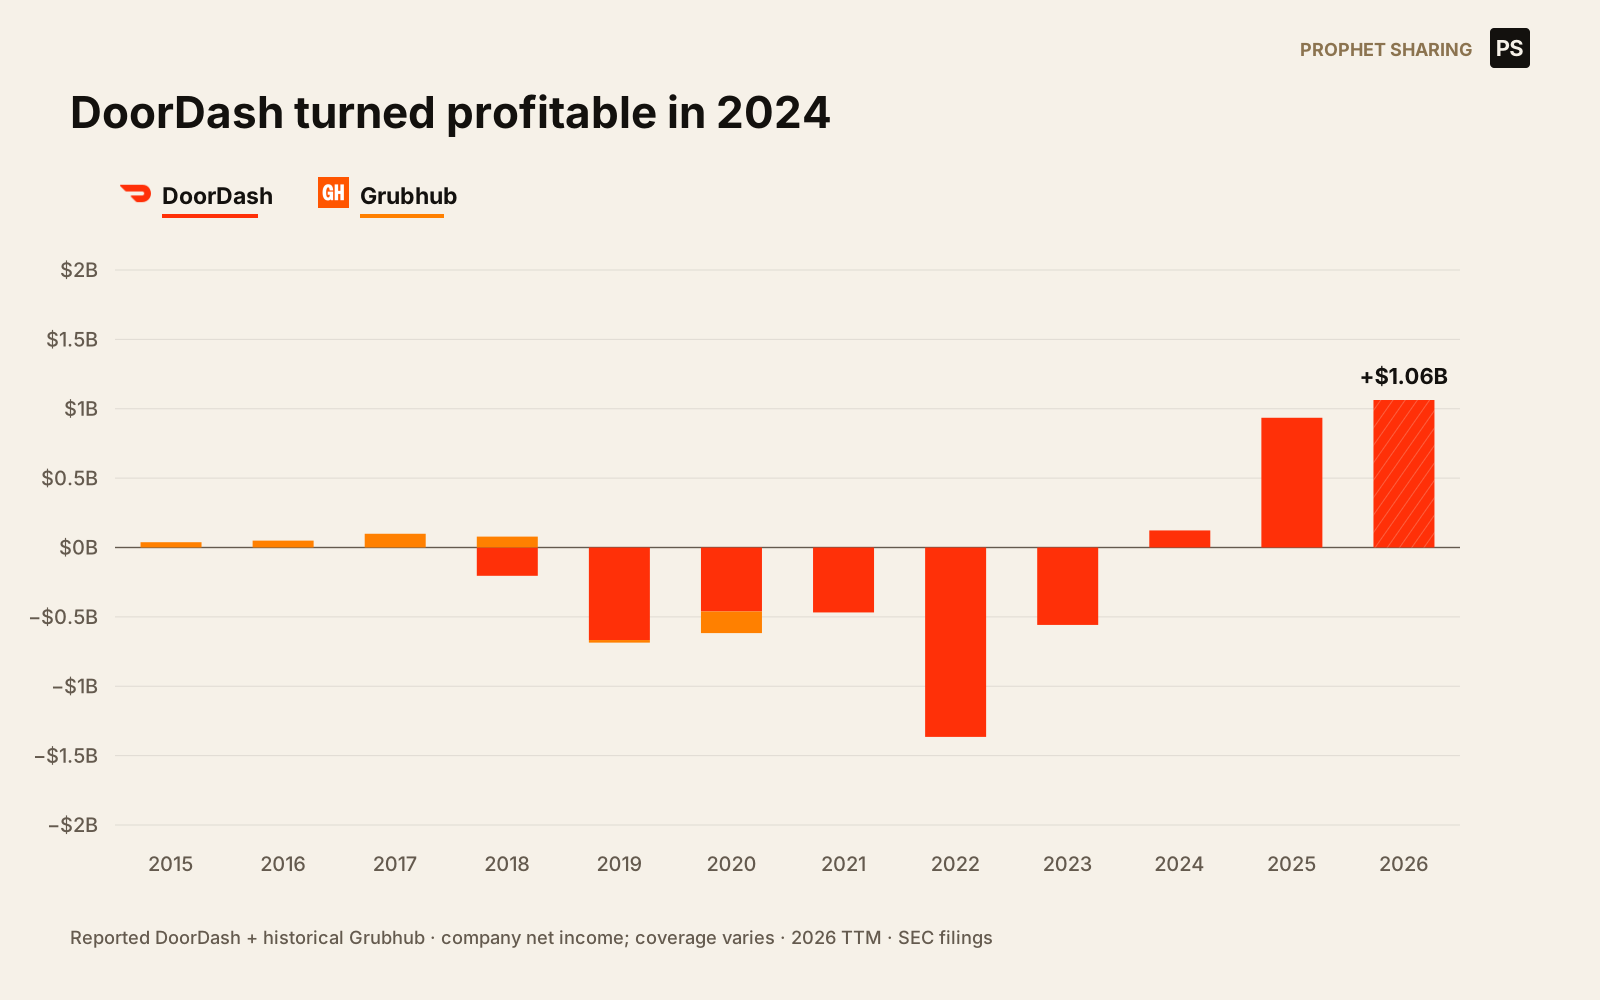
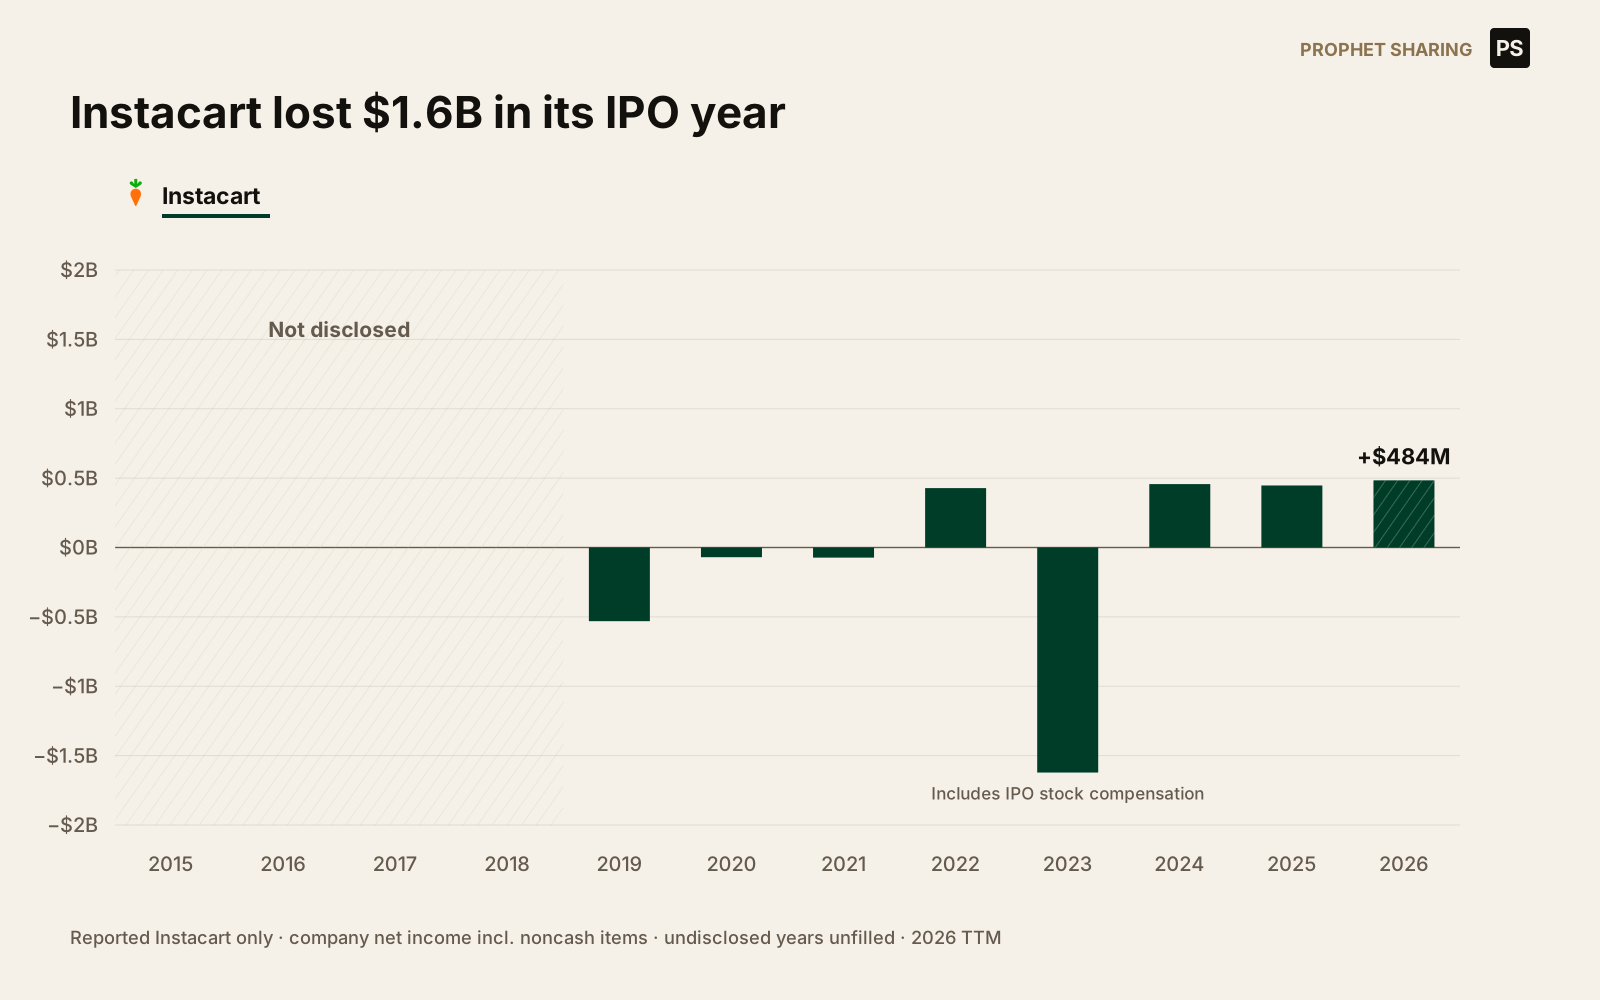
Profit charts show disclosed company GAAP net income, with positive and negative bars stacked separately. DoorDash uses net income attributable to common stockholders; historical Grubhub ends in 2020. Grocery covers Instacart only. Undisclosed years remain null. Instacart's 2023 loss includes IPO stock compensation. The 2026 net-income values are TTM: DoorDash $1.063B and Instacart $484M. Neither is U.S. delivery-only industry profit.
food share CSV · food annual order-value CSV · food net-income CSV · grocery share CSV · grocery annual order-value CSV · grocery net-income CSV
- instacartS1
- instacart2025
- instacart2026
Do not use common-share EPS numerator after preferred accretion as consolidated net income.
- dd2020
- dd2022
- dd2023
- dd2025
- dd2026
- grub2019
- grub2020
Historical standalone series stops here; no combined JET Canada/U.S. number is passed off as Grubhub.
- historicalGrocery
2015–2019 food/beverage ecommerce estimates credited to EMARKETER, reproduced by Bloomberg Intelligence in 2020. Digitize only the white ecommerce bars; do not add the store-fulfilled blue channel. Approximate historical values, about ±1B digitization tolerance. This narrower definition is not appended to the broader 2021–2025 Brick Meets Click grocery series. 2020–2024 forecasts in the source are not used as observations.
- instacartEarlyGtv
Embedded original image retained as sources/instacart-early-gtv.png. Image x positions 108/138/167/198; top y 434/431/423/402; zero at y438, $30B at y50. Early points rounded to match image resolution. 2018 cross-check: disclosed 80% 2018–2022 CAGR implies $2.746B from 2022 $28.826B.
- walmartFootprint
Grocery footprint growth proxy, not sales. November 2015 count from Q3 FY2016 call; 2016/2017 counts from following annual reports; 2018 from FY2019 annual report. Constant modeled volume per location is an assumption; a 50–150% level sensitivity is retained.
- walmart2017
- walmart2018
- walmart2019
- walmart2015
- krogerEarlyGrowth
Digital includes pickup, delivery and pharmacy e-commerce; used only as a growth proxy after rebasing to the selected basket, with 70–130% sensitivity.
- kroger2019Growth
- freshDirect2015
Other combines this FreshDirect level with a separately identified $150M allowance for remaining selected channels in 2015. It is not a disclosed total for Other.
- freshDirect2016
- freshDirect2017
- amazonEarlyGrowth
Use relative Amazon growth only. 2015 extrapolates the 2016–2017 ratio backward one year. Broad sales/shares are not spliced into the narrower ordering-channel basket. Walmart broad grocery series is retained as a scope cross-check, not used as fresh-grocery pickup dollars.
- marketBSM
One April 2024 source vintage for the 2019–2024 segment. Grocery can be included. Four displayed brand groups are normalized to their subtotal. ASAP and all other platforms excluded from this long-history comparison. Direct-brand/owner definitions differ over time after acquisitions.
- ceFood
Original early-2026 three-brand panel. Unlike the Orion/Vela Gamma graphics, this is US Transact and excludes the wider residual basket. Cross-panel level comparisons are modeled. The historical Super Bowl-day bars are not annual observations. Postmates working allocation is 0.05%, with a 0–0.1% sensitivity bound informed by the 2024 graphics.
- ceNov2024
Original quarterly-to-date graphic inspected. Broad national source basket. Postmates is below 0.1%; its midpoint, not the full residual, is used in the four-brand reconstruction.
- ceDec2024
Original national graphic inspected. The November graphic names Orion; this one names Vela Gamma. Do not interpret their difference as pure business growth. All published levels and denominators retained before four-brand normalization.
- ceSep2025
Original chart visually inspected; the 5.2 label belongs to Grubhub, 4.3 to Olo. Postmates is unlabeled at the endpoint. Preserve a 0.05% working allocation rather than manufacturing a measured value.
- yipit
Tracked panel, not all online grocery. Instacart marketplace and storefront are distinct channels. Other = storefront, Shipt, FreshDirect, DoorDash and Uber. Main lines digitized about ±1 pp; small values not independently extracted.
- em2026
October 2026 model vintage. 2026 is a full-year forecast, used to inform the current estimate, not relabeled as an observed September panel share. Its all-online-grocery share LEVEL is never spliced into the narrower Yipit basket; only relative 2024–2026 movement is used.
- walmart
2026 Q2 means calendar quarter ended July 31, fiscal Q2 FY2027. Broad U.S. ecommerce, including non-grocery, is a growth proxy. Fiscal-year growth is mapped to the preceding calendar year as an approximation, not a grocery-only observation. Annual dollar figures also appear in Walmart 10-K/10-Q.
- kroger
Use UNADJUSTED 14% for 2026, not headline adjusted 20%. Digital includes pickup, delivery, third-party orders and other changes. 2025 adjusted 17% is a proxy and is sensitivity-tested. 2024 11% is a historical operating proxy, not a recovered calendar-year grocery series.
- amazon
North America segment growth is a weak proxy for the specific Amazon grocery channels in Yipit. It includes Canada, general merchandise, services and other businesses. 2024/25 proxy growth is set to 10%, not claimed as measured grocery growth; wider bounds cover faster fresh-grocery rollout.
- bmcAnnual
2023-vintage annual graphic used consistently. Earlier 2021 release said 97.7; retain the later 97.6 vintage rather than mix revisions.
- bmcMonthly
Annual totals calculated from 12 rounded monthly reports, not quoted full-year exact figures. All 24 links, amounts and local receipts are retained in bmc-monthly.csv / JSON. Main text takes precedence over obvious image-alt typos, notably January 2025 ($10.0B, not $9.6B).
- bmcQ32026
Q3 2026 level is calculated: ($10.0B + $11.2B + $12.5B) × 1.207 ≈ $40.7B. Rounding in the reported monthly baseline limits precision. Four times Q3 is an annual pace, not full-year 2026 sales. No missing H1 2026 actuals are invented.
- bmcWalmart2024
Walmart excludes Sam’s Club. Full U.S. online grocery market, not the narrower Yipit selected-channel basket.
- bmcWalmart2026
Working 39.5% and 38.5–40% sensitivity range are interpretations of the qualitative statement, not exact reported percentages. Hold this mid-2026 working level through Q3 as an explicit assumption.
- edison2019
Independent panel cross-check, not spliced into Bloomberg history. The article headline says Grubhub 23 but the comparison paragraph says 22; retained as 22–23, not false precision. Basket includes Other/Caviar and source vintage differs.