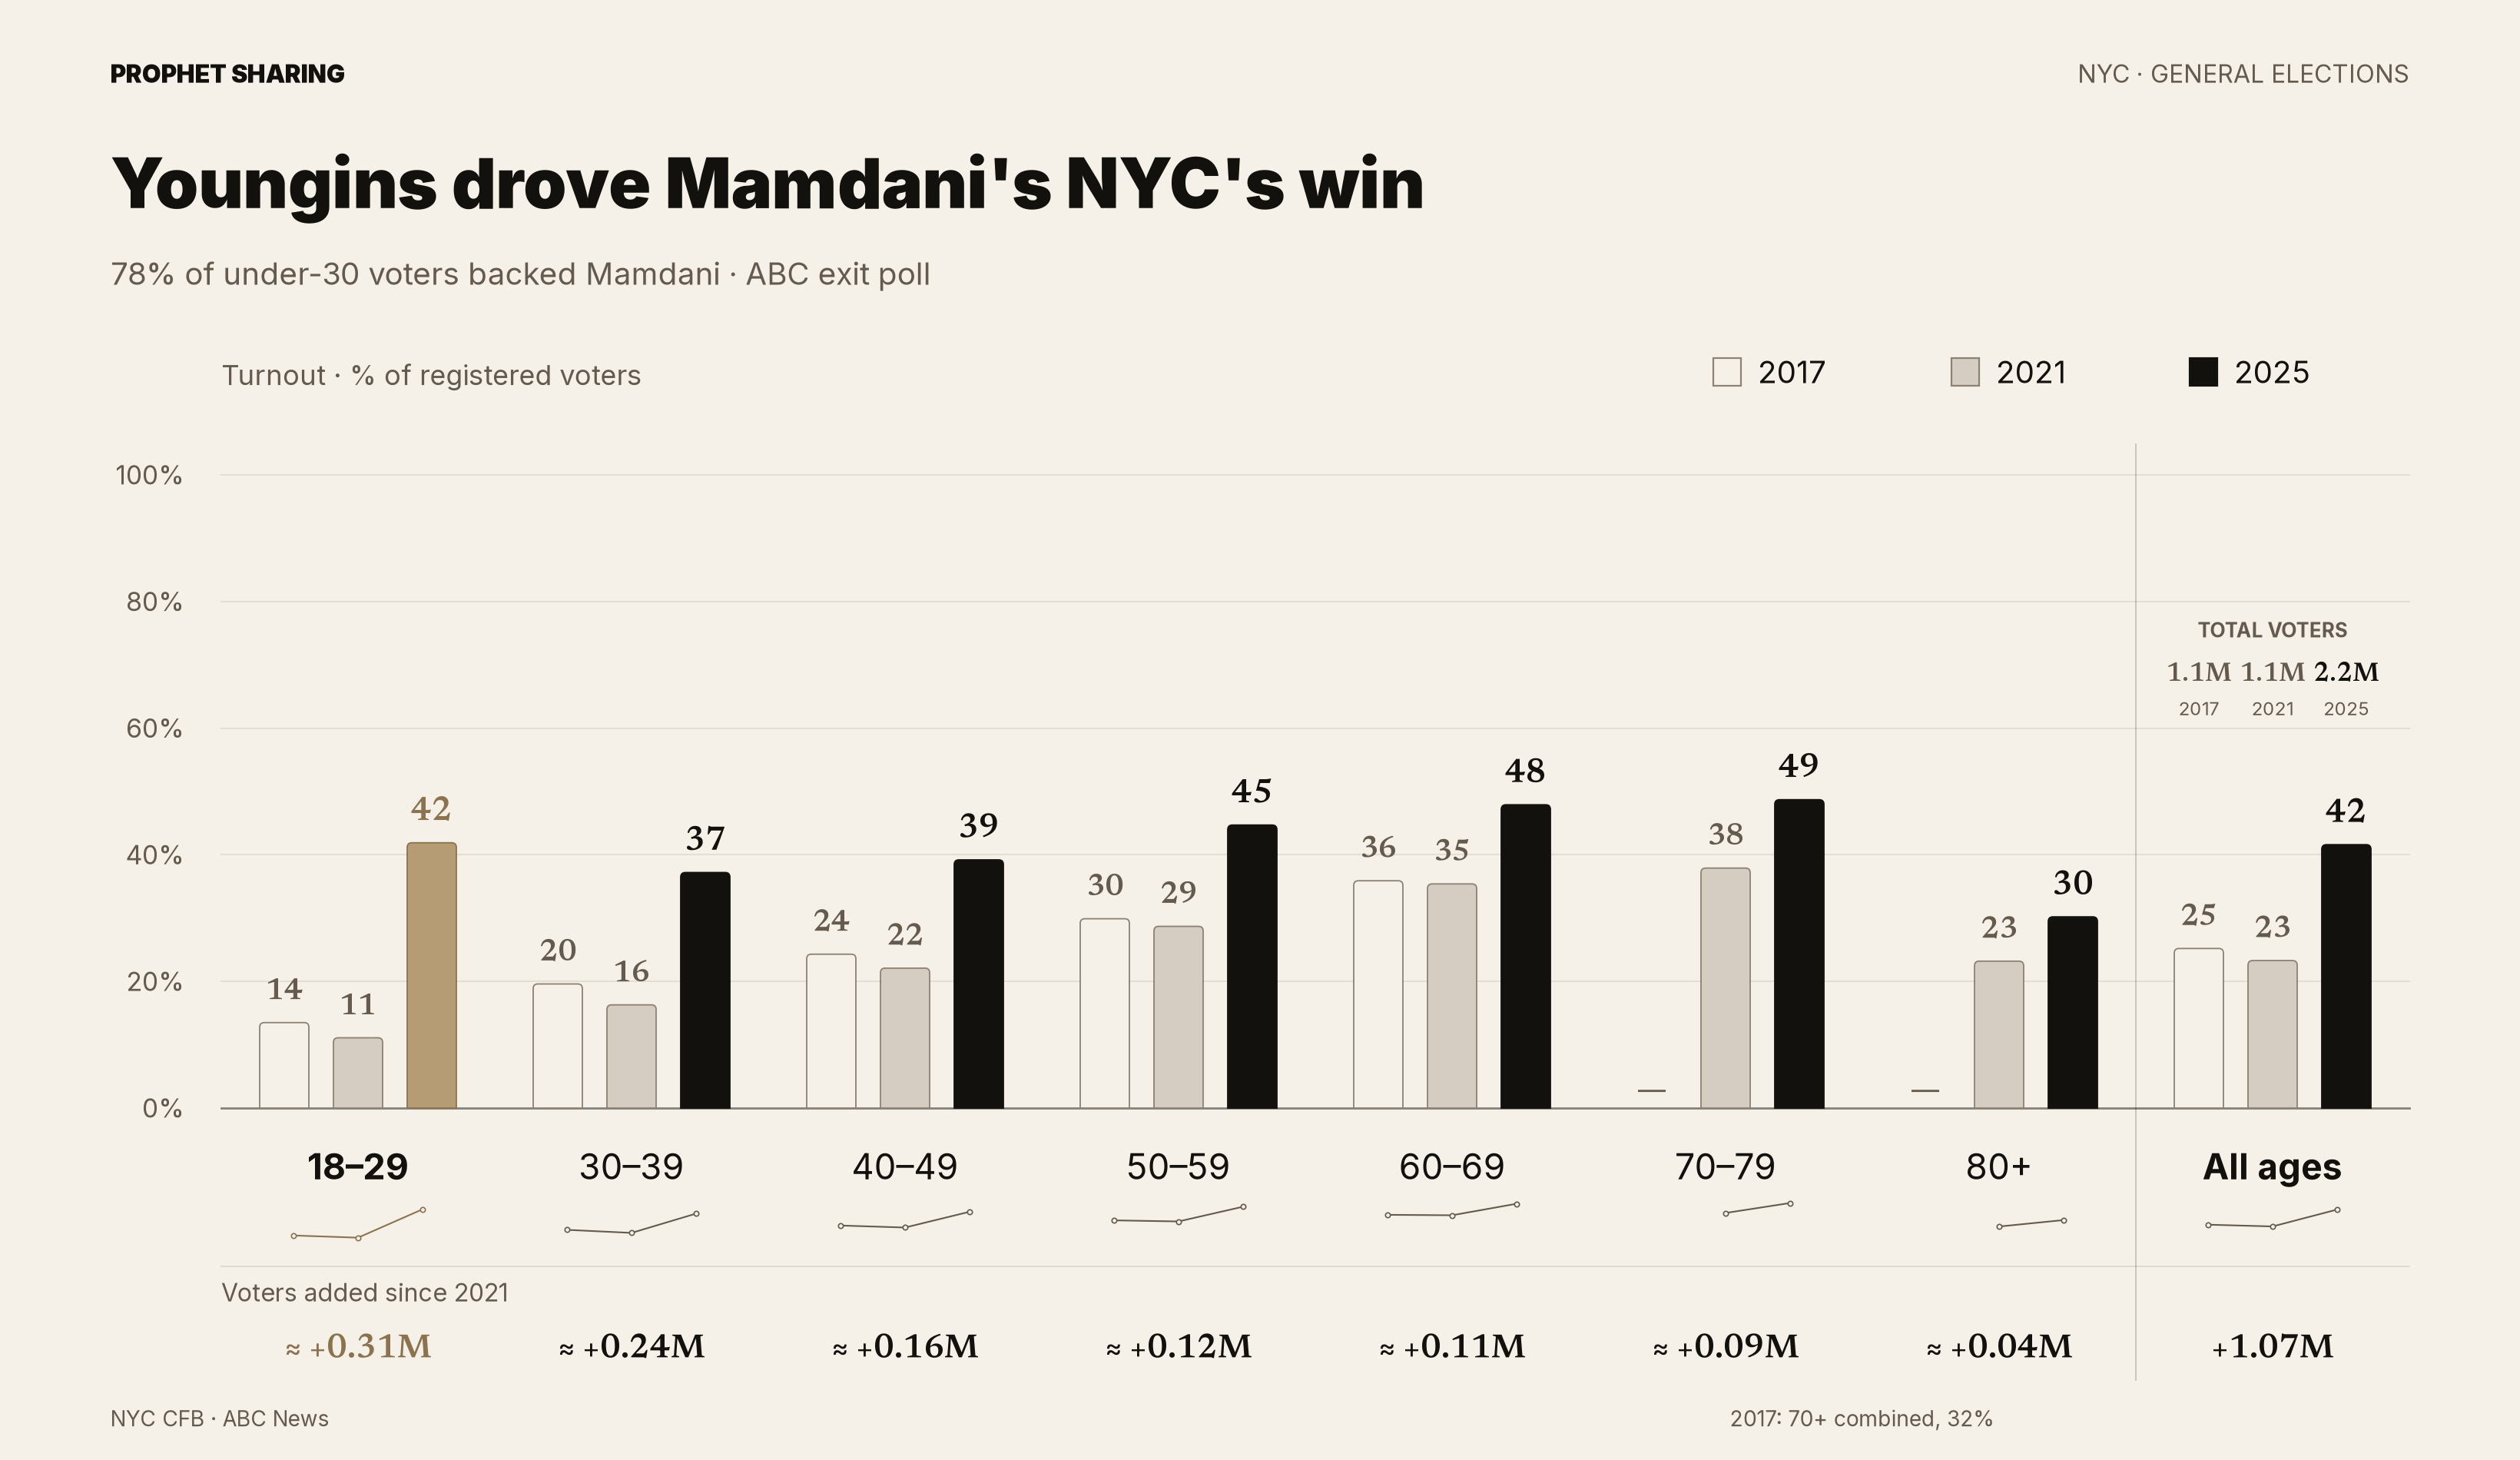
Youngins drove Mamdani's NYC's win
Sources & data
NYC Campaign Finance Board, 2017–18, 2021–22 and 2025 reports; ABC News / SSRS exit poll. Additional voters by age are estimates from rounded report shares; citywide totals are reported counts. 2017 uses active rolls and combines ages 70+.
Chart text
PROPHET SHARING NYC · GENERAL ELECTIONS Youngins drove Mamdani's NYC's win 78% of under-30 voters backed Mamdani · ABC exit poll Turnout · % of registered voters 2017 2021 2025 0% 20% 40% 60% 80% 100% 14 11 42 18–29 ≈ +0.31M 20 16 37 30–39 ≈ +0.24M 24 22 39 40–49 ≈ +0.16M 30 29 45 50–59 ≈ +0.12M 36 35 48 60–69 ≈ +0.11M — 38 49 70–79 ≈ +0.09M — 23 30 80+ ≈ +0.04M 25 23 42 All ages +1.07M Voters added since 2021 2017: 70+ combined, 32% TOTAL VOTERS 1.1M 2017 1.1M 2021 2.2M 2025 NYC CFB · ABC News